

Another seven days of data and as promised I double-checked the baseline values and thresholds as mentioned in the erratum of last week’s post: Heart coherence, week 1. The threshold for HRV differs slightly from the one mentioned in the protocol post. This happened when the numbers from the last couple of days of the baseline were added to the calculation.
Reminder: these are just my weekly numbers and they should not be seen as results. We can speak of those when the experiment concludes, after two months of data. Checking the numbers weekly will be interesting, but the actual results will only be visible at the finish line.
The (double-checked) baseline
For starters a quick recap of the baseline. These graphs are the standard to which the numbers of the following weeks will be compared.
More information about these graphs can be found in the post Heart coherence, the start.
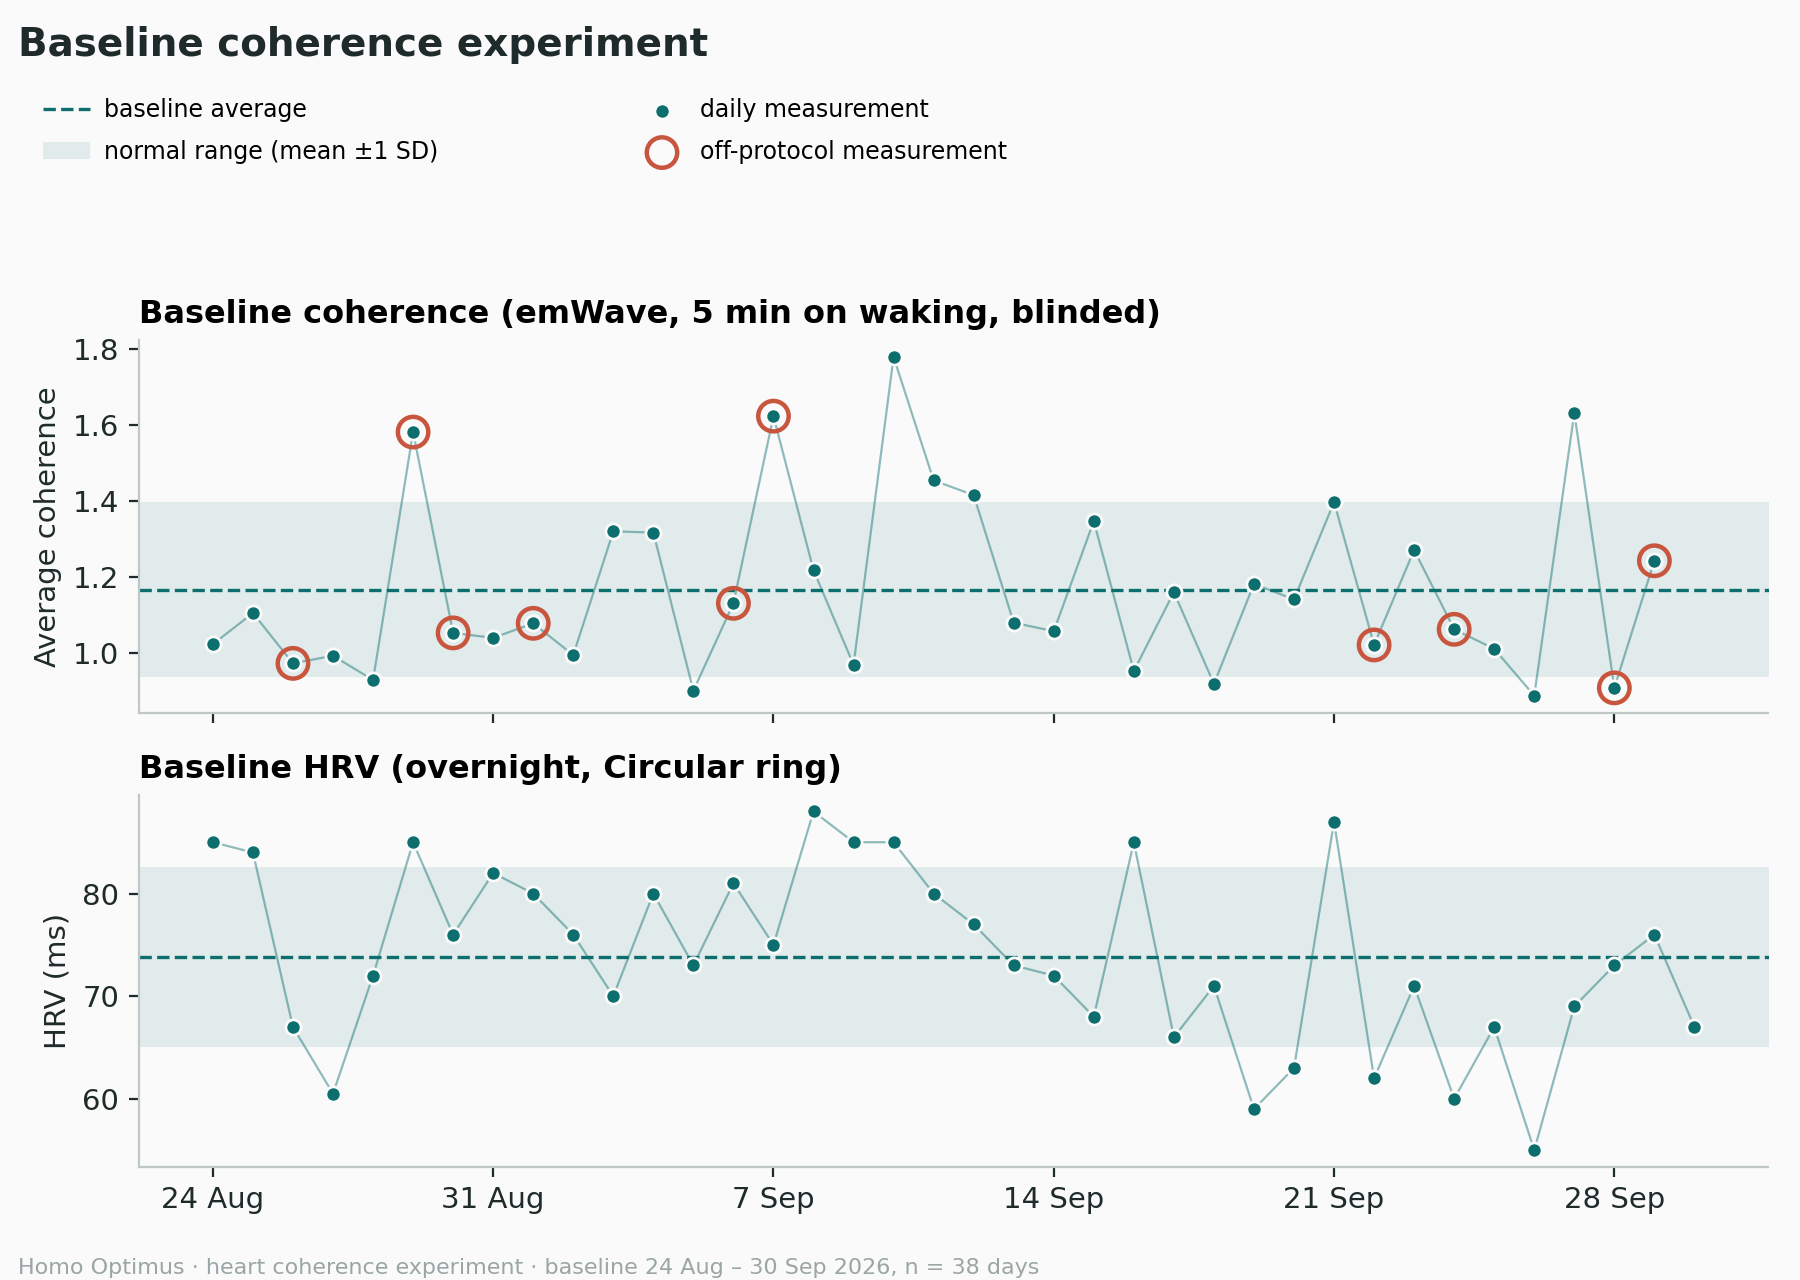
Thirty-eight days of baseline data (24th of August - 30th of September) spread over two graphs, missing only the daily coherence measurement on the 30th of September. The top one shows my average coherence during the baseline sessions, as measured with the emWave pro. The bottom one is my overnight HRV value provided by my Circular Ring.
Average coherence:
The mean average coherence is 1.17 with a standard deviation (SD) of 0.23.
Average overnight HRV:
The mean average overnight HRV is 73.8 ms with an SD of 8.8 ms.
Thresholds:
For coherence the established threshold is 1.26 and for overnight HRV it is 78.5 ms.
The coherence threshold of 1.26 is identical to the one published in the protocol post. The HRV one is slightly lower than the 79.2 ms mentioned, making my experiment marginally easier.
The numbers
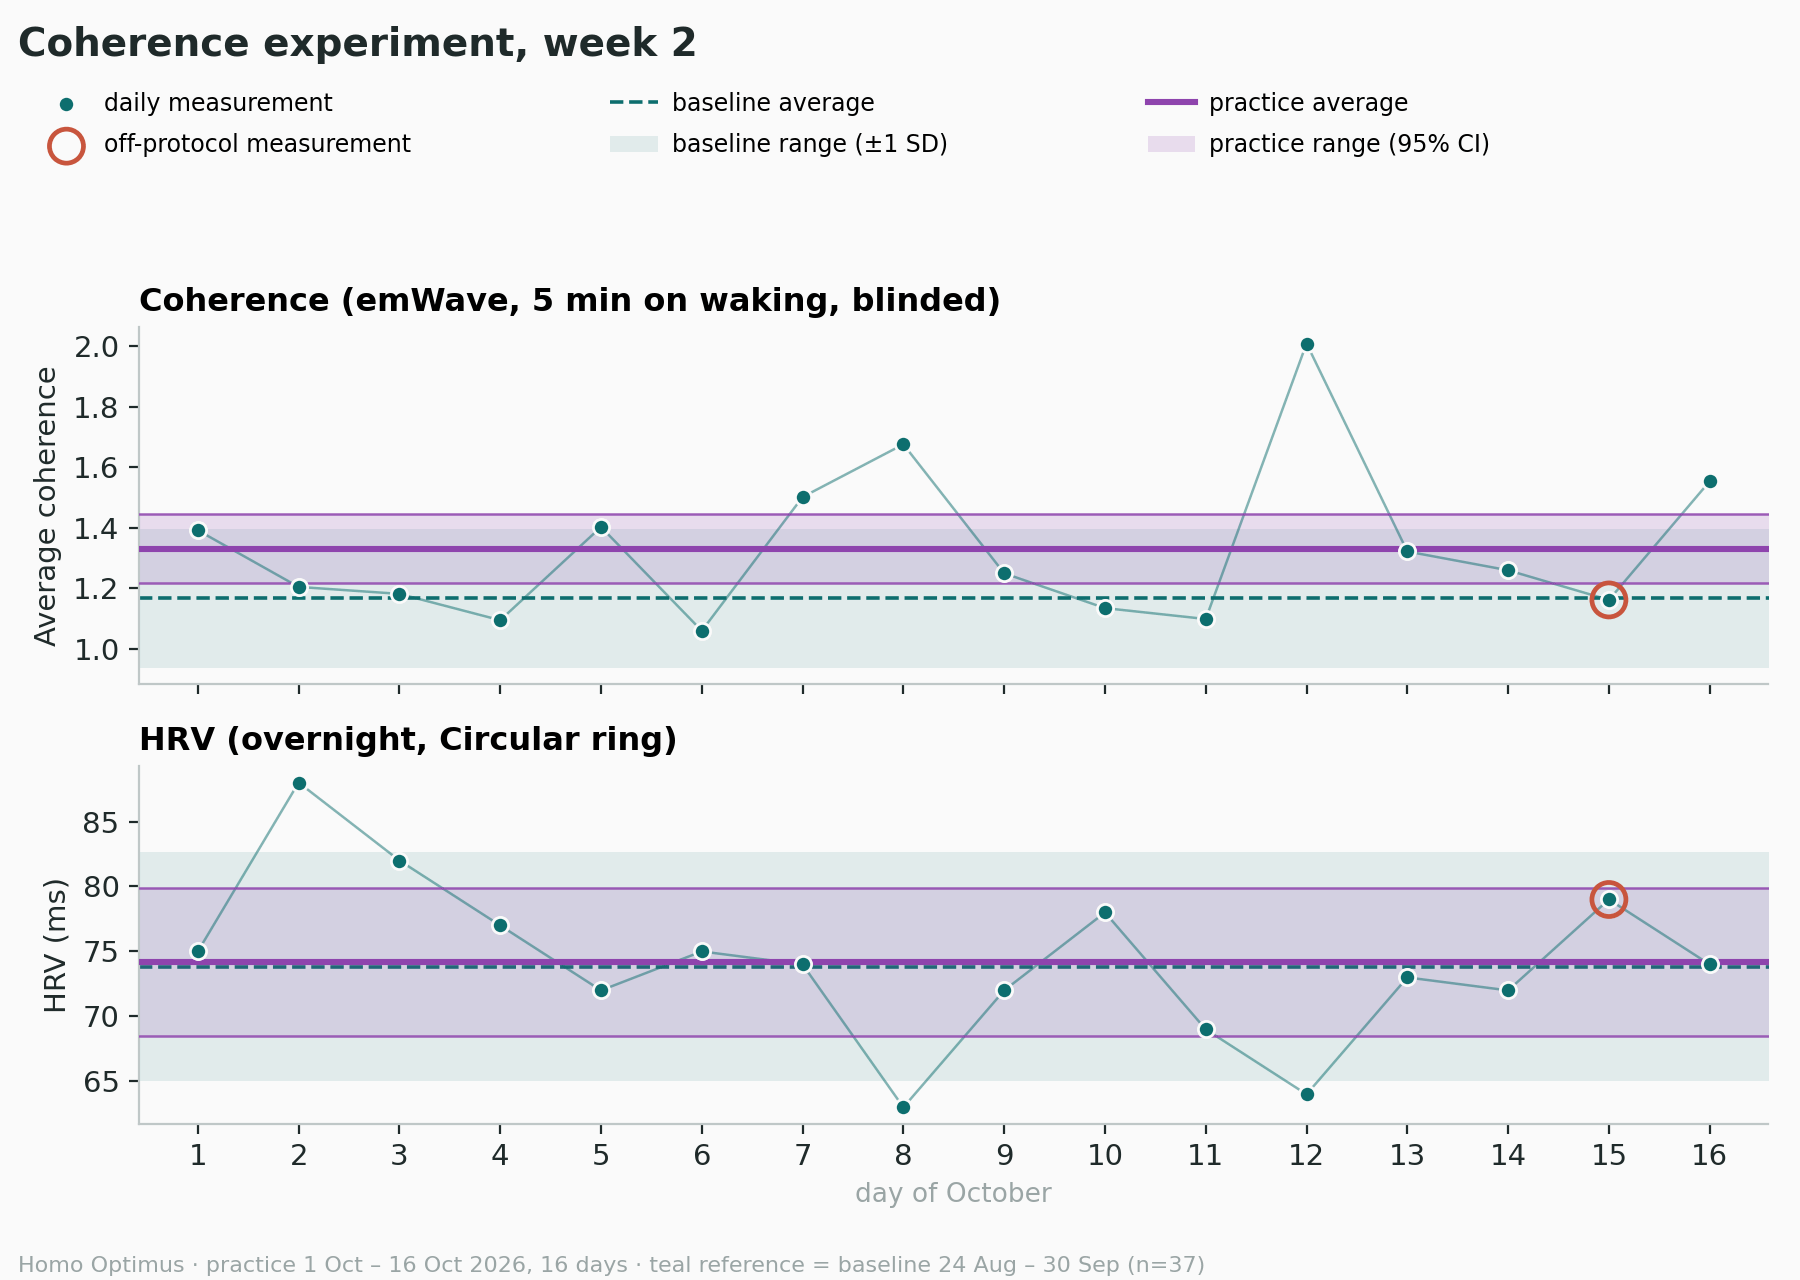
The graphs below contain the data from the experiment. They show the same information as the baseline ones, with two additions.
A purple line showing the practice average and a purple range band that shows the confidence interval (CI) of this average. These will change weekly when the new numbers are added to the analysis.
Average coherence:
The mean average coherence so far is 1.33 (up from 1.17) with an SD of 0.25.
Average overnight HRV:
The mean average overnight HRV so far is 74.2 ms (up from 73.8 ms) with an SD of 6.2 ms.
Confidence interval:
It was mentioned in last week’s post that the band would become smaller with every reading added and you can clearly see this happening. What is interesting is that you can now see the average baseline coherence falls outside of the CI. This means the experiment data and the baseline data are now distinguishable.
A short explanation on the CI can be found in Heart coherence, the start.
Off-protocol measurements:
One off-protocol measurement this week on the 15th of October. This one is due to artefacts1. When a session contains more than 5% of them, it is flagged as off-protocol. This week’s flagged session contained 5.02% artefacts.
Interpretation:
For the second week in a row now the average coherence sits (only slightly) above the established threshold. The SD went up from 0.20 to 0.25 though, meaning that the readings are more spread out. New for this week, as I just mentioned, is that the average baseline coherence now falls outside of the CI. This is progress, but still not a result. I want the CI to clear the threshold too.
The numbers for this week include a high reading on the 12th of October, as you can see on the top graph. Without this reading, the experiment and baseline data would not yet be distinguishable.
Overnight HRV is still a little bit higher than the baseline, but the threshold of 78.5 ms has not yet been crossed. Week 2 on its own actually sits below baseline, which is interesting, since it clearly shows how readings can differ from one week to another.
Success can only be measured at the end. About six more weeks to go :)
Adherence
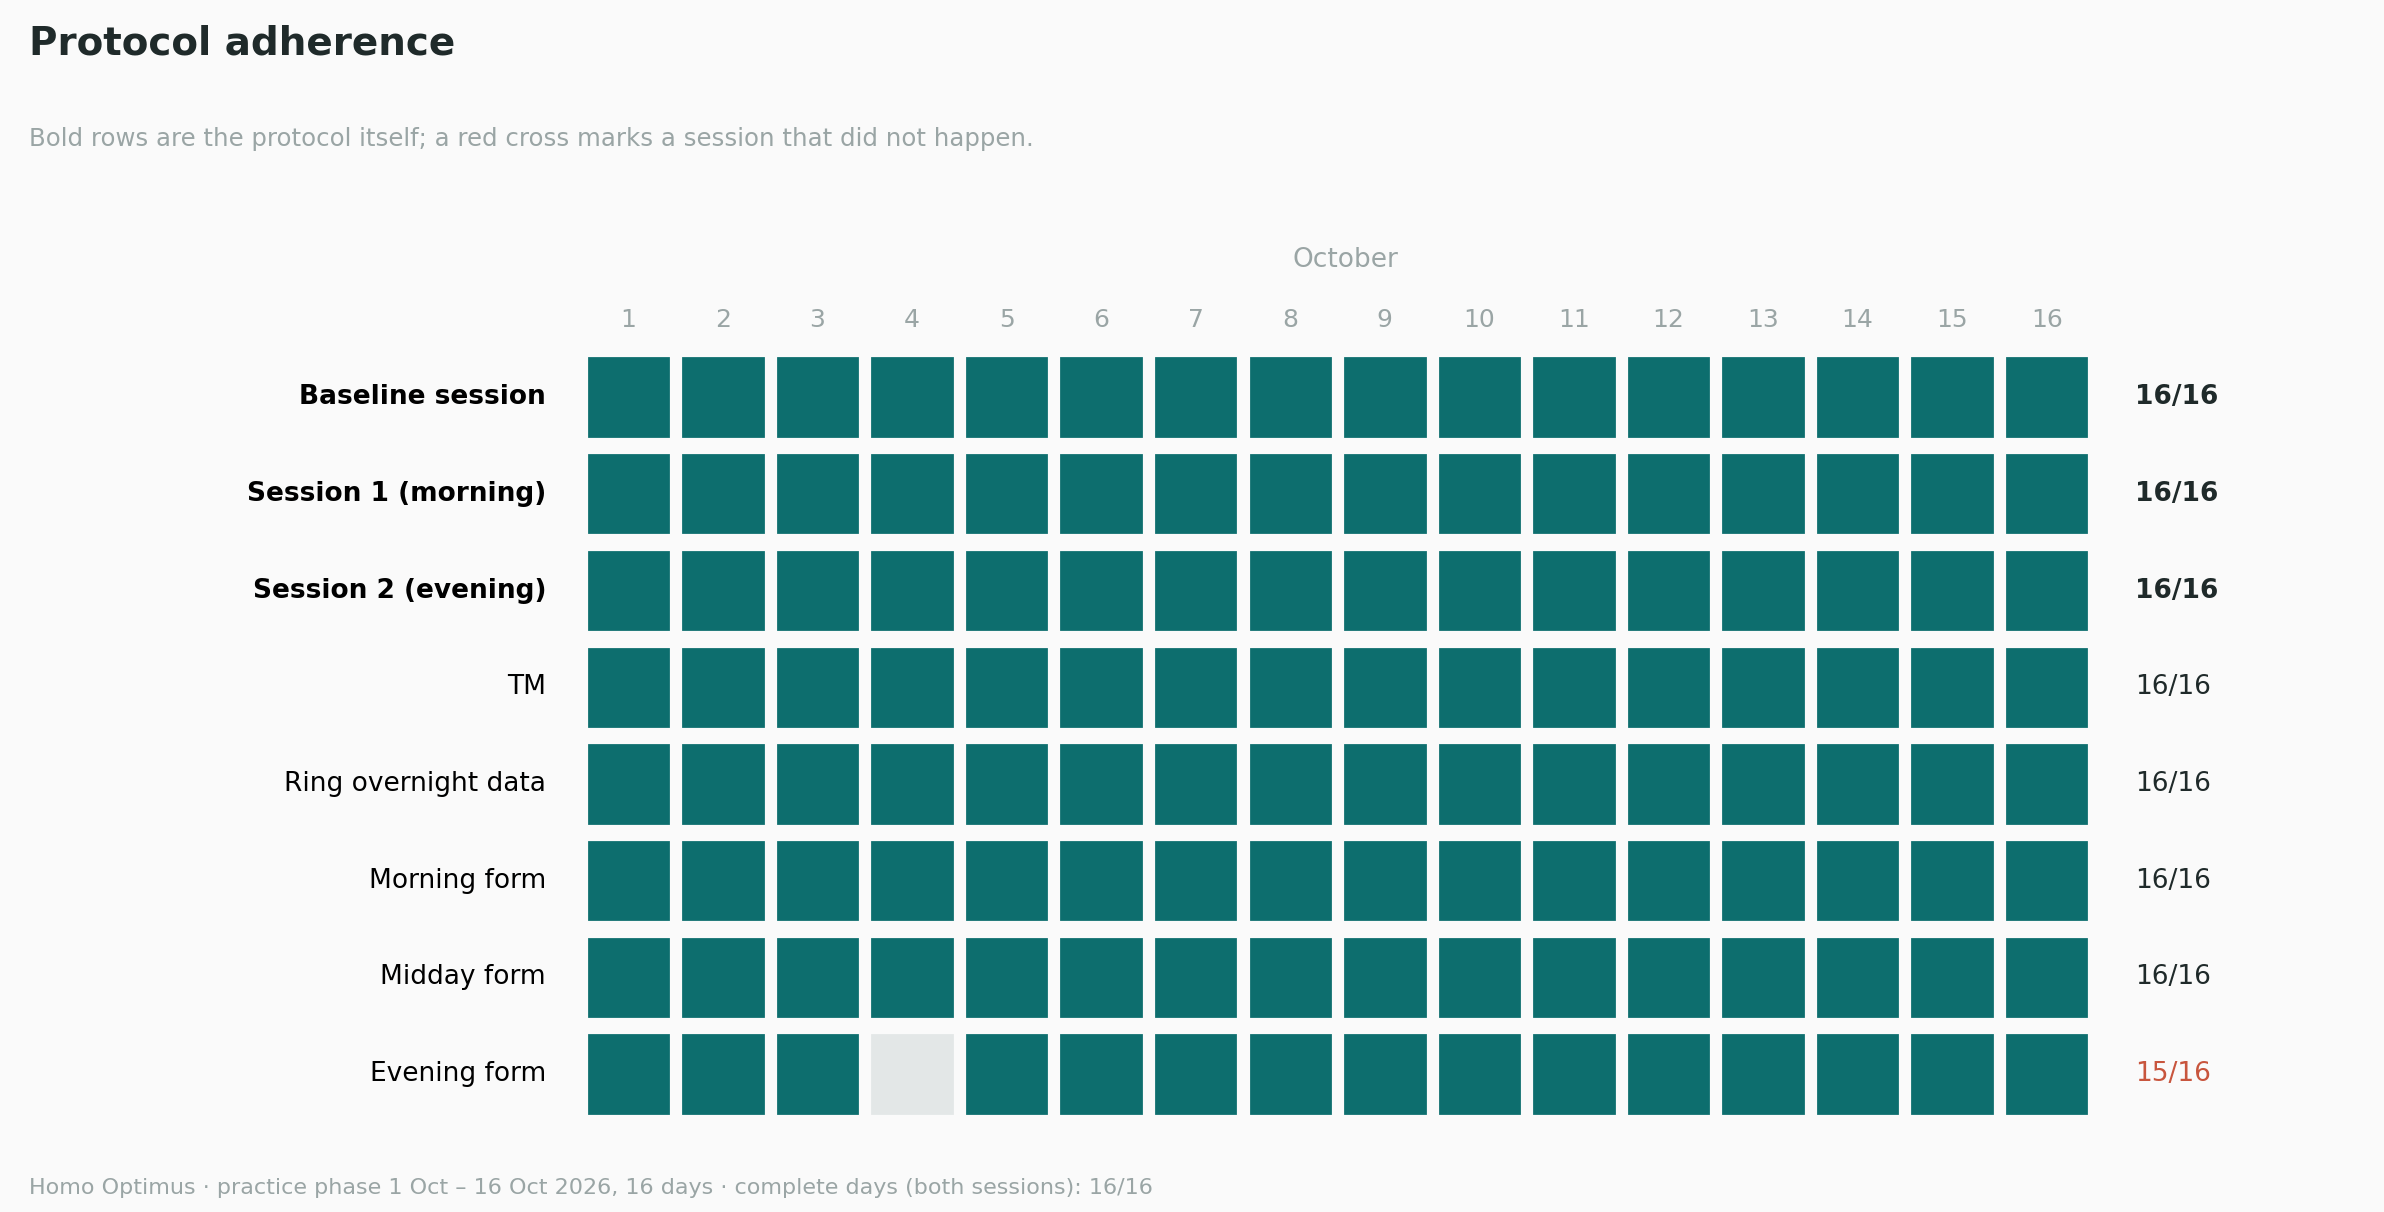
The adherence grid below shows how well I stuck to the protocol. The top three rows are the most important. They specifically concern the baseline and practice sessions. These will be marked with a red cross when they have not been executed.
The rows below show how well I logged everything else in my app. These will be blank when they are not filled in.
Protocol adherence:
Complete
Logging adherence:
Complete for this week
What was going on
All in all it was a rather busy week, but my log clearly shows that I got calmer. Makes sense after last week’s events.
An interesting note on the artefacts of the 15th of October. I logged that I sneezed a couple of times during that session. This is a perfect example of what an artefact could be and it shows the usefulness of logging.
Artefacts are faulty recordings, in this case in the emWave application. These can be caused by a shifting ear sensor, swallowing, movement, etc. For this experiment a beat is an artefact if it is shorter than 300 ms or longer than 2000 ms, or if it differs by more than 20% from the median of its ten nearest neighbours.