

The numbers of the first nine days of two daily coherence sessions are in.
Erratum, 10 Oct: I used baseline values calculated on only part of the baseline period. The correct figures are marked in the text below, and the wording adapted where needed. I am double-checking the thresholds and will report on those next week!
Reminder: these are just my weekly numbers and they should not be seen as results. We can speak of those when the experiment concludes, after two months of data. Checking the numbers weekly will be interesting, but the actual results will only be visible at the finish line.
The baseline
For starters a quick recap of the baseline. These graphs are the standard to which the numbers of the following weeks will be compared.
More information about these graphs can be found in the post Heart coherence, the start.
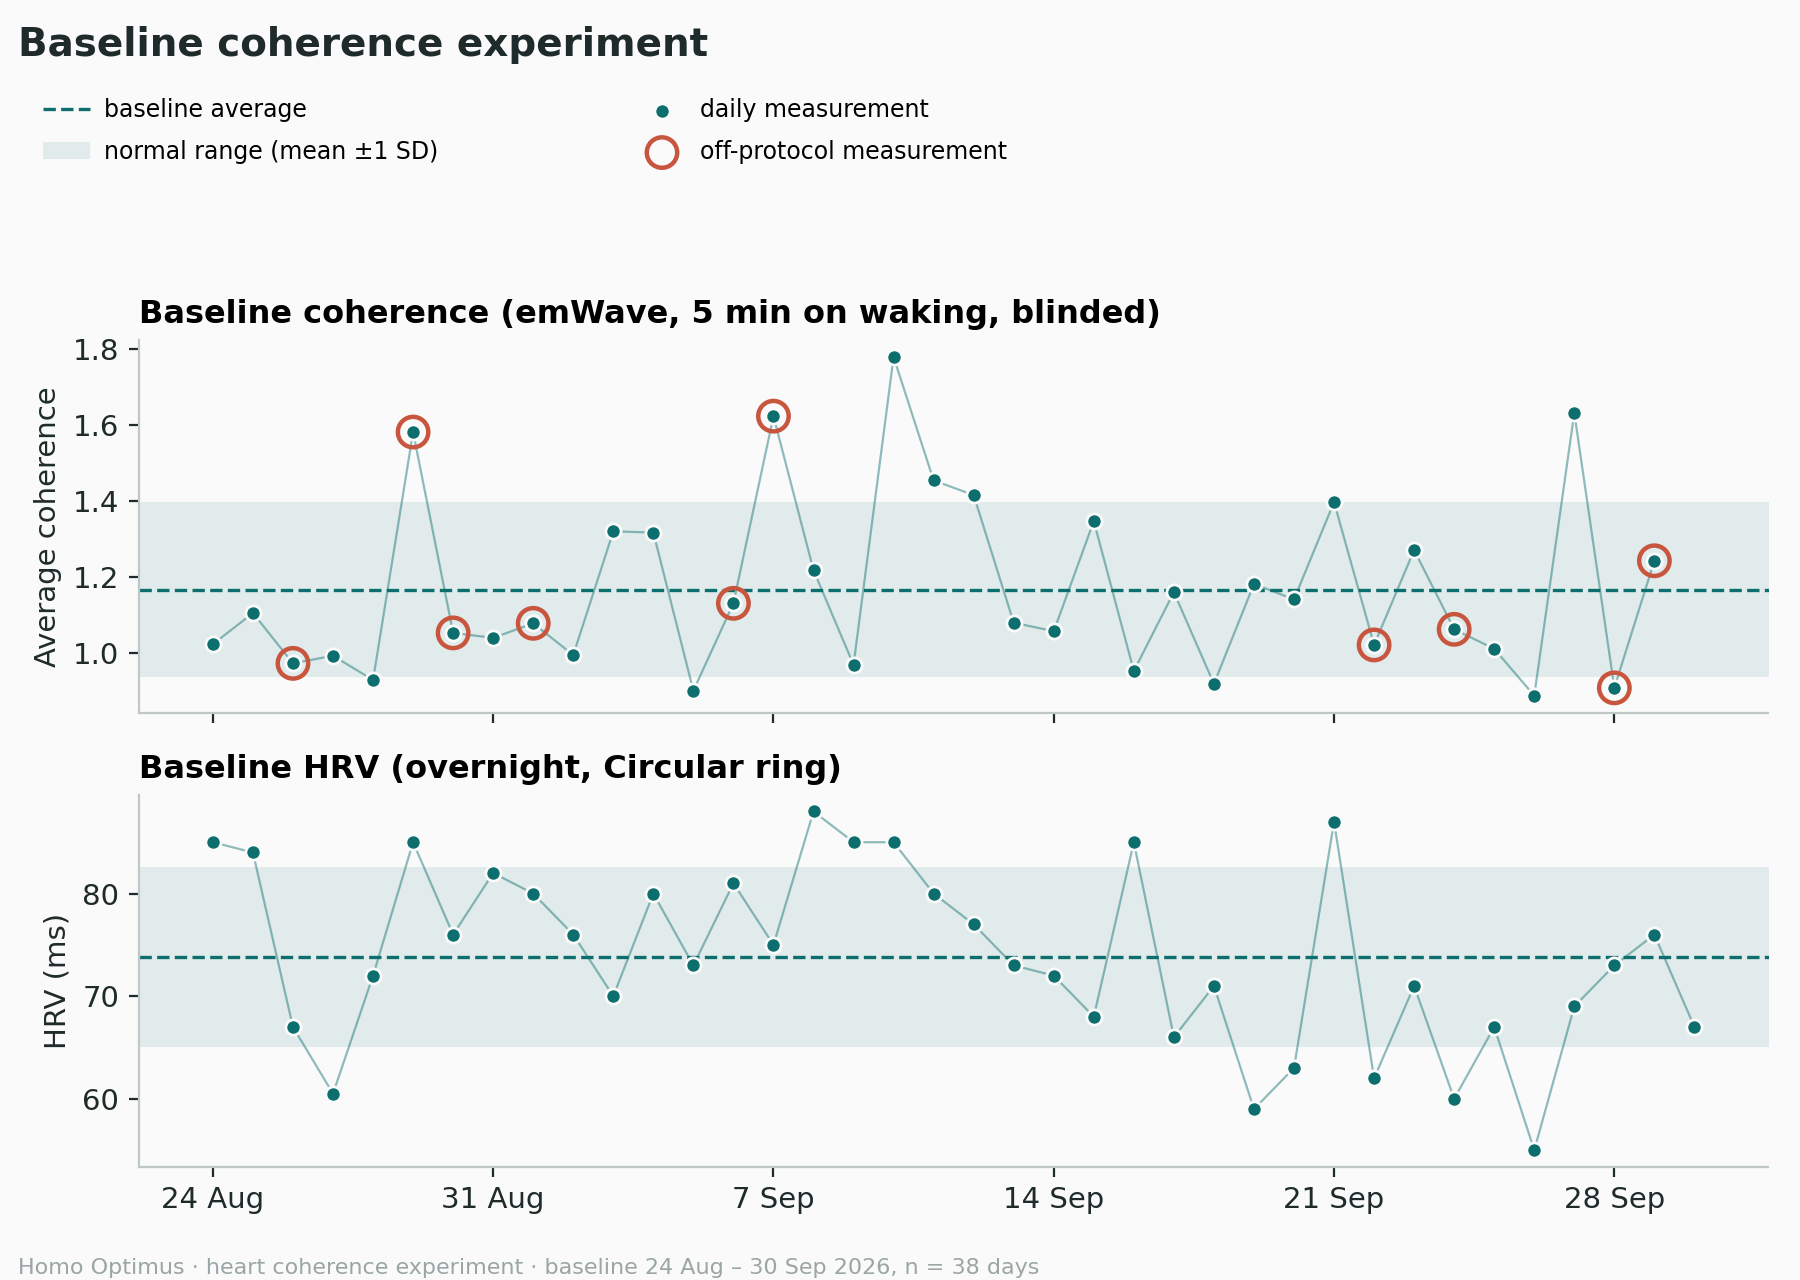
Thirty-eight days of baseline data (24th of August - 30th of September) spread over two graphs, missing only the daily coherence measurement on the 30th of September. The top one shows my average coherence during the baseline sessions, as measured with the emWave pro. The bottom one is my overnight HRV value provided by my Circular Ring.
Average coherence:
The mean average coherence is 1.17 with a standard deviation (SD) of 0.22 0.23.
Average overnight HRV:
The mean average overnight HRV is 75 ms 73.8 ms with an SD of 8.7 ms 8.8 ms.
The numbers
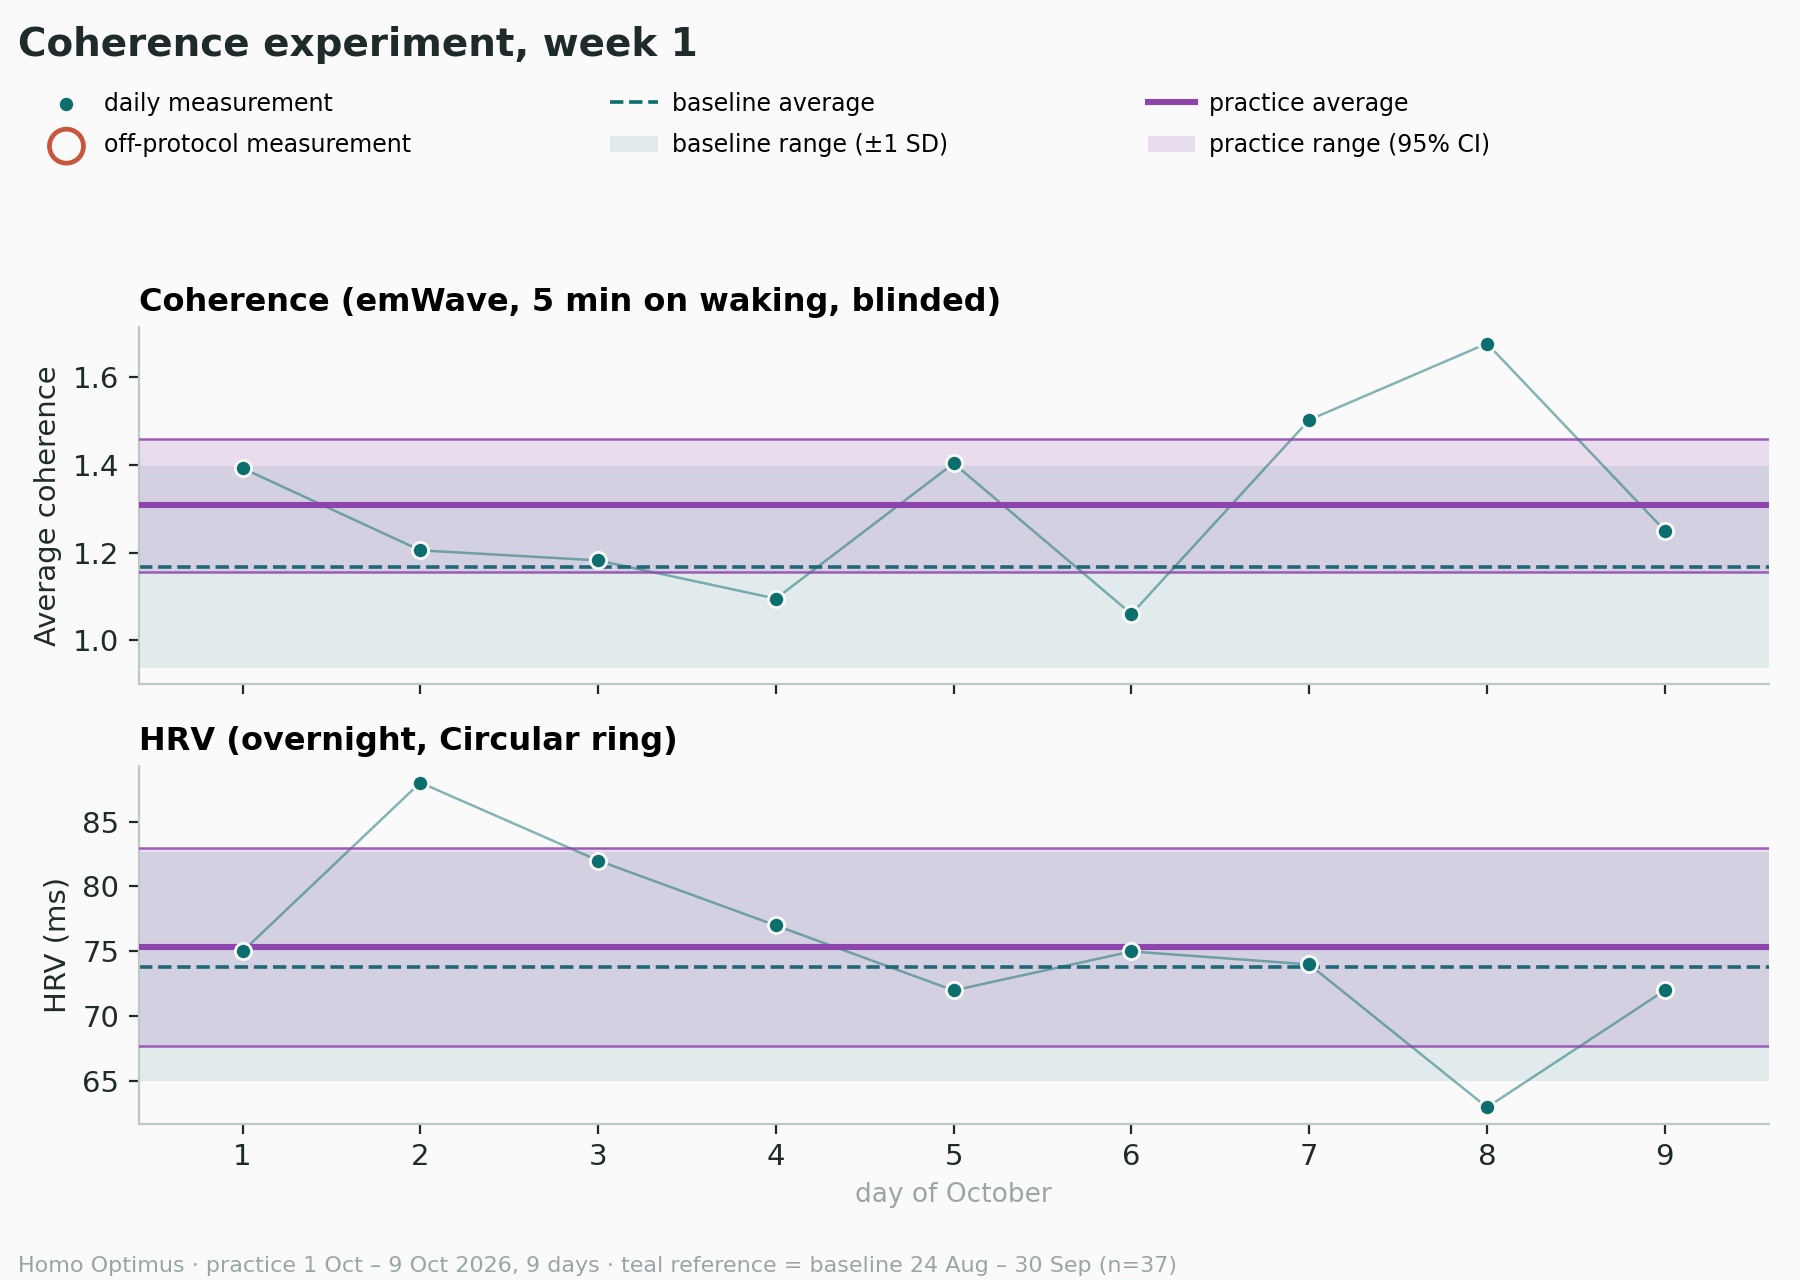
The graphs below contain last week’s numbers. They show the same information as the baseline ones, with two additions.
A purple line showing the practice average and a purple range band that shows the confidence interval (CI) of this average. These will change weekly when the new numbers are added to the analysis.
Average coherence:
The mean average coherence so far is 1.31 (up from 1.17) with an SD of 0.20.
Average overnight HRV:
The mean average overnight HRV so far is 75.3 ms (up from 73.8 ms) with an SD of 6.9 ms.
Confidence interval:
At first sight it looks like the purple band can be directly compared to the teal band showing the SD from the baseline readings. This is however not the case!
The teal band shows one SD. It means that about two in three readings fall within this range and it shows us the typical morning. The purple band, on the other hand, shows the 95% CI1.
Currently there are only nine readings, which is not a lot. An average based on only a few values is not precise. The more numbers we add to the analysis, the smaller this purple band will become.
Worth noting that right now the baseline average still falls within the practice range CI. This means they are not yet distinguishable. As soon as the baseline average falls outside, we can start talking about a separation. This would be a progress signal, but not yet a success criterion.
Interpretation:
As mentioned earlier, we can hardly draw conclusions from the first nine days of an experiment. Yes, the average coherence is now just above the 1.26 threshold I fixed in the protocol post – as noted above, I am verifying this figure. If this holds over the coming weeks, until the end of the experiment, it is a nice start. HRV on the other hand only sits marginally above the baseline number.
With the CI integrated in the graphs, I will make it a bit harder on myself. I want to surpass the established thresholds, but I also want the CI to be higher than these thresholds to declare success.
Adherence
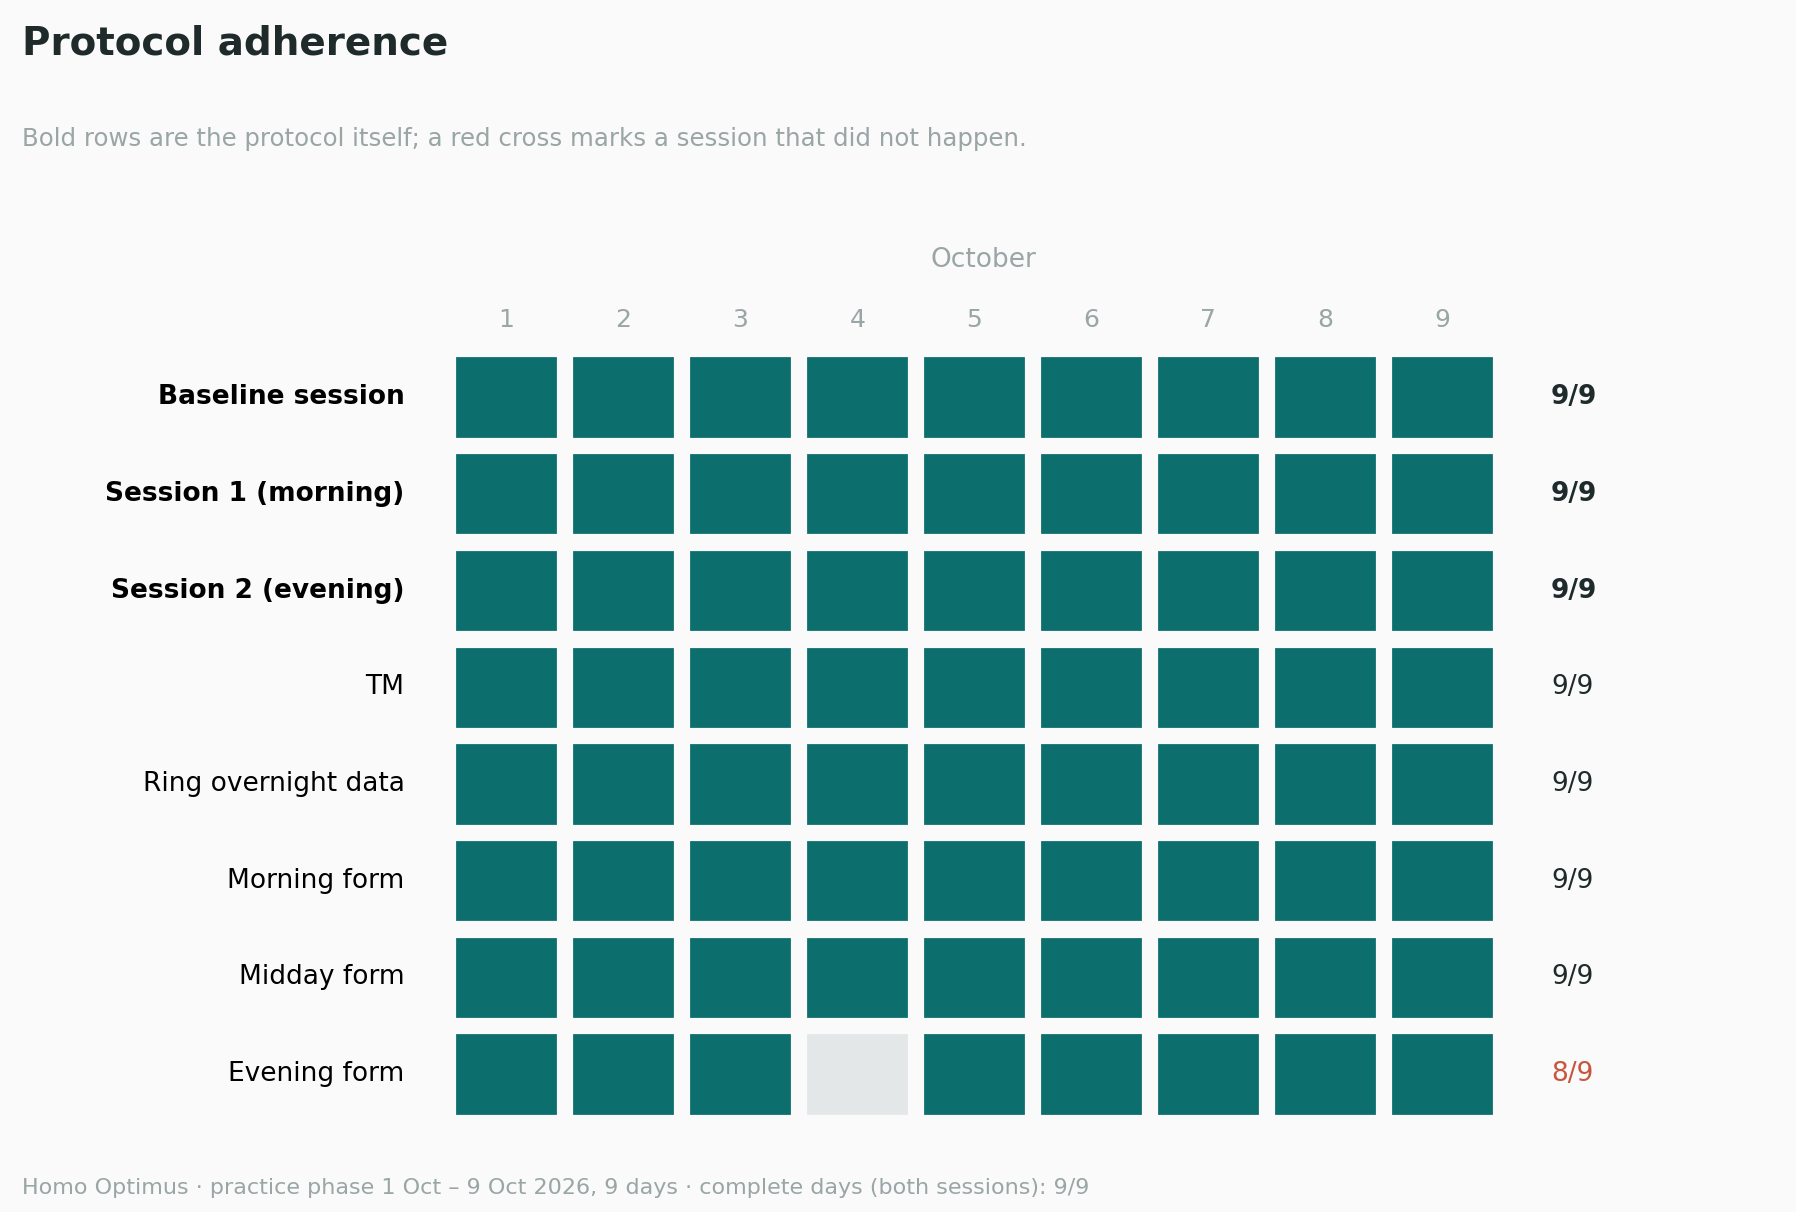
The adherence grid below shows how well I stuck to the protocol. The top three rows are the most important. They specifically concern the baseline and practice sessions. These will be marked with a red cross when they have not been executed.
The rows below show how well I logged everything else in my app. These will be blank when they are not filled in.
Protocol adherence:
Complete
Logging adherence:
Missing the evening form on the 4th of October
What was going on
Sadly, the past few days were anything but average. My grandfather passed away at the age of 94. Apart from the last few years, he was always in good health and determined to turn 100 one day. Since he will no longer be able to do so, I hereby officially declare I will take over this quest from him!
While the numbers of this week might seem “normal” or as expected, the events have taken a toll on me. It did not happen unexpectedly and it was a beautiful moment in its own right, but it nevertheless impacted my mental and physical state.
Requiescat in pace bompa…
The 95% confidence interval refers to the method rather than to this particular band. If I ran the experiment many times and calculated a band each time, 95% of those bands would capture the true average. Why not put it at 100% and be completely sure? In this case the band would cover the whole graph and not be useful.
But we are digressing.