

The 1st of October, the start of my first experiment. Before showing the full data of the baseline measurements, I have to admit something. The 29th of September was a bit of a hectic day, it got rather late for my liking and I forgot my emWave in my car. What does this mean? It means I have no baseline reading for the 30th of September. First time this has happened since I started and it gave me a valuable reminder to always keep the device with my laptop.
This post will replace the one I would normally put out on Saturday (only for this week). Better to post the final baseline data now before starting than showing you two days of data on Saturday.
It will also serve as a first draft for the layout of my reporting. So if there are any remarks, just respond to this post or email me!
The protocol
The protocol has now been fixed as it has been published. The SHA-256 of the text is: 507d3626f13dd12d9286a4f45e212715e8ae176132e2c2c46dc68deb69f369c7.
Holy crap, what did I just read? You could consider those numbers and letters to be the fingerprint of the protocol text. If I were to change anything, this hash will no longer match.
Currently this does not yet allow anyone, besides me, to check the text. I will publish the protocol text as a plain file in the days to come, so everyone can verify whether the file matches the hash.
I have also archived the post on web.archive.org under the following link.
Baseline data: primary metrics
The same graphs I have shown in my last publication, but more polished. This time I will dive a bit deeper since this is the finalisation of my baseline period.
The period:
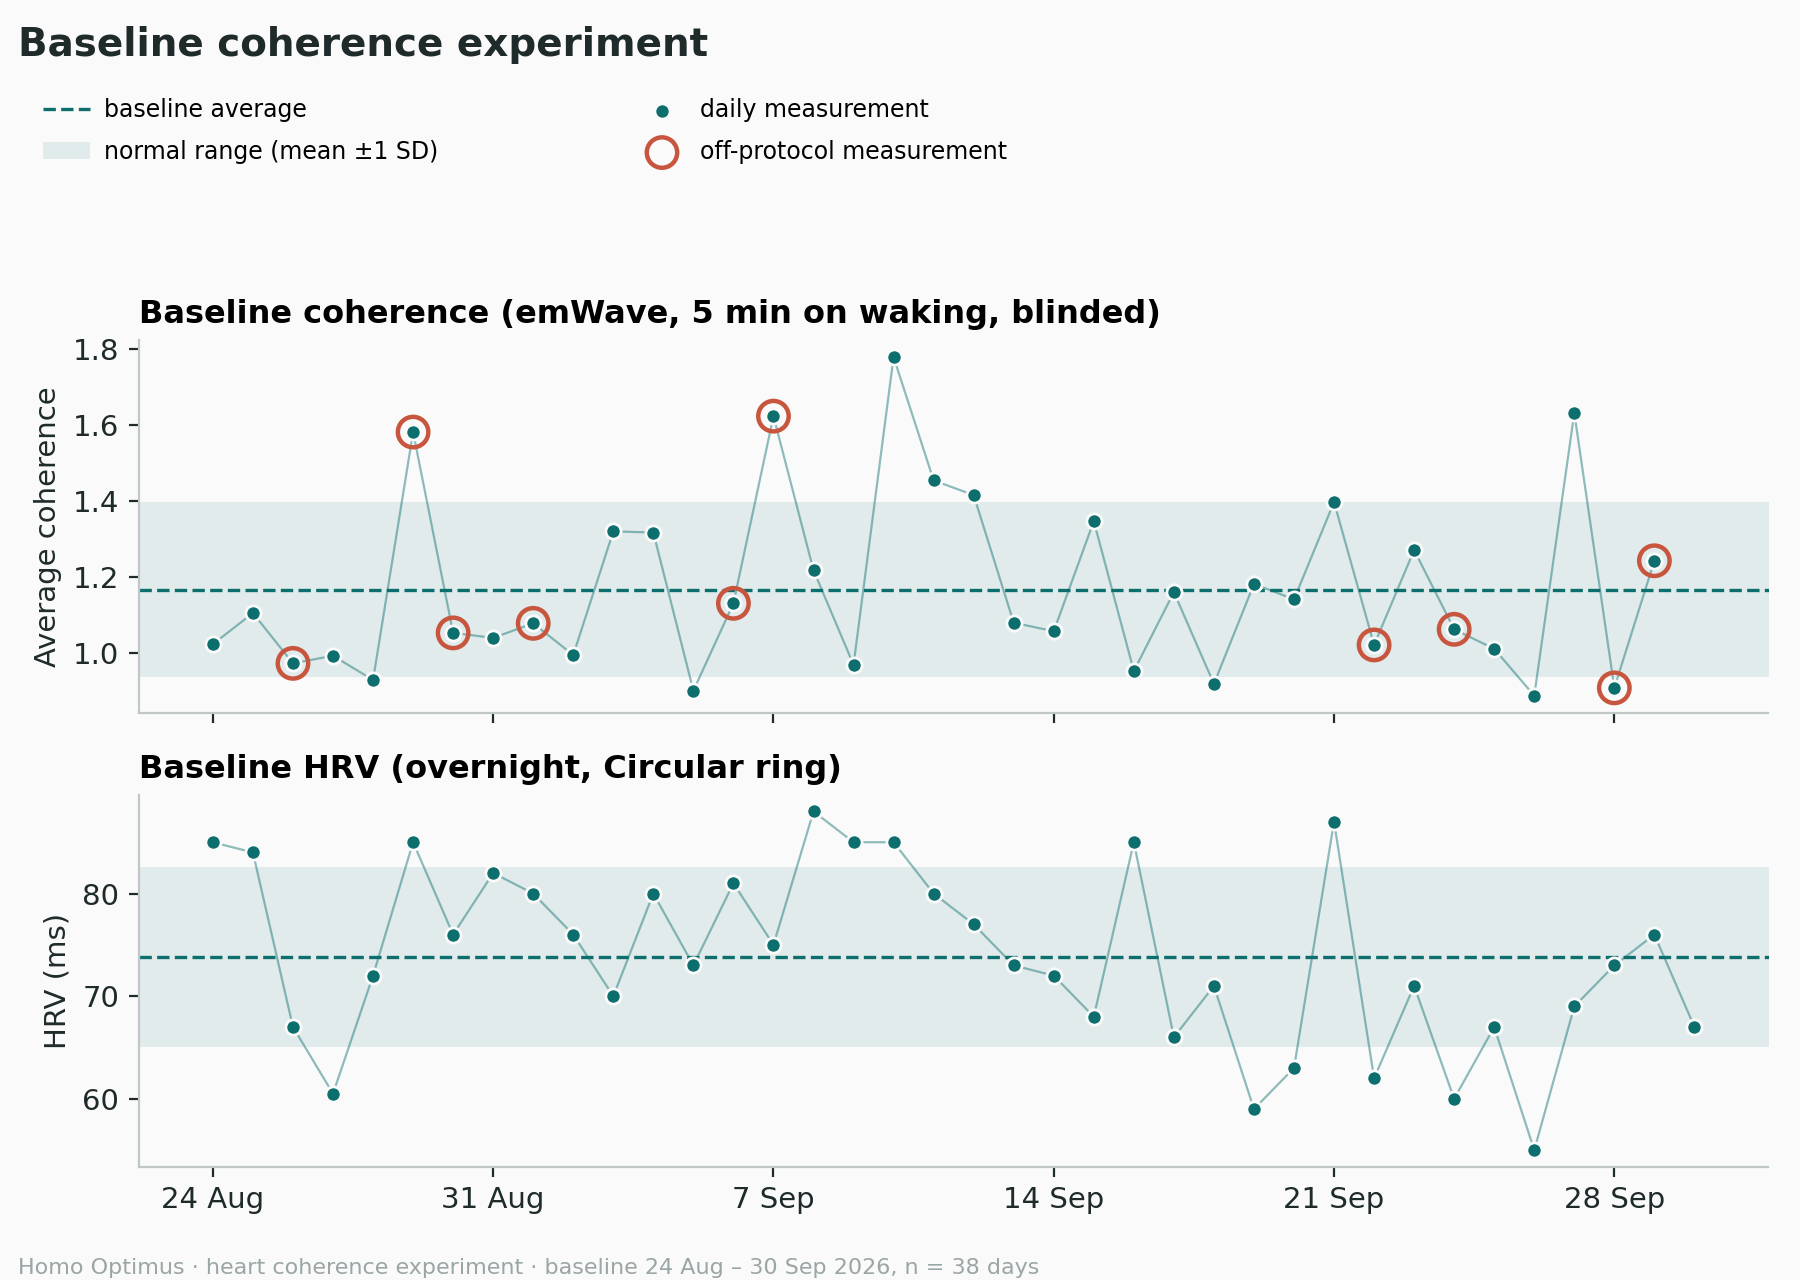
I ran the baseline measurements with the emWave pro from the 24th of August to the 30th of September. Thirty-eight days, of which thirty-seven have a baseline measured. Each dot you see on the graphs is the reading of a specific day, which you can see on the bottom. The dates marked at the bottom are always a Monday.
The graphs:
The top graph shows my average coherence during the baseline sessions, as measured with the emWave pro. The bottom graph is my overnight HRV value provided by my Circular Ring.
The legend:
I already mentioned the little green dots being readings linked to each morning’s baseline session. Let me explain the rest of the information on the graphs.
The X-axis represents the timeline and the Y-axis shows either the average coherence (top graph) or the HRV (Circular Ring, bottom graph). Whenever a green dot is circled, this means the conditions for the measurement were not standard1. The line connecting the dots is just there to show the trend in a more visual way. The dotted line shows the baseline mean, calculated from all the baseline measurements. This line will remain my “baseline” for the rest of the experiment.
Finally the green zone represents one standard deviation (SD) up or down from my baseline. It visualises the normal range of the day-to-day variation. The thresholds in the protocol are derived from the SD. Once an average value lands and stays outside of this range, it means something.
Baseline data: secondary metrics
The analysis of the secondary metrics has not been done yet. The logging app only covers the most important metrics and I still need to pull the data from various devices and apps. Posting them now would take us too far, but I will report on the analysis in a future publication.
Outside of the usual window, away from home, known disturbances.