

The heart coherence experiment has been running for a month now (minus the data from today). The most important conclusion so far is that it is really hard to draw conclusions. So many factors can influence the outcome and it is very hard to attribute the results to practice or mere chance. It also shows how easily a routine is disrupted. Feeling a little off, having a few unexpected drinks during a social dinner, not sleeping at home, etcetera. Anything could have an impact on the numbers.
Reminder: these are just my weekly numbers and they should not be seen as results. We can speak of those when the experiment concludes, after two months of data. Checking the numbers weekly will be interesting, but the actual results will only be visible at the finish line.
The (double-checked) baseline
For starters a quick recap of the baseline. These graphs are the standard to which the numbers of the following weeks will be compared.
More information about these graphs can be found in the post Heart coherence, the start.
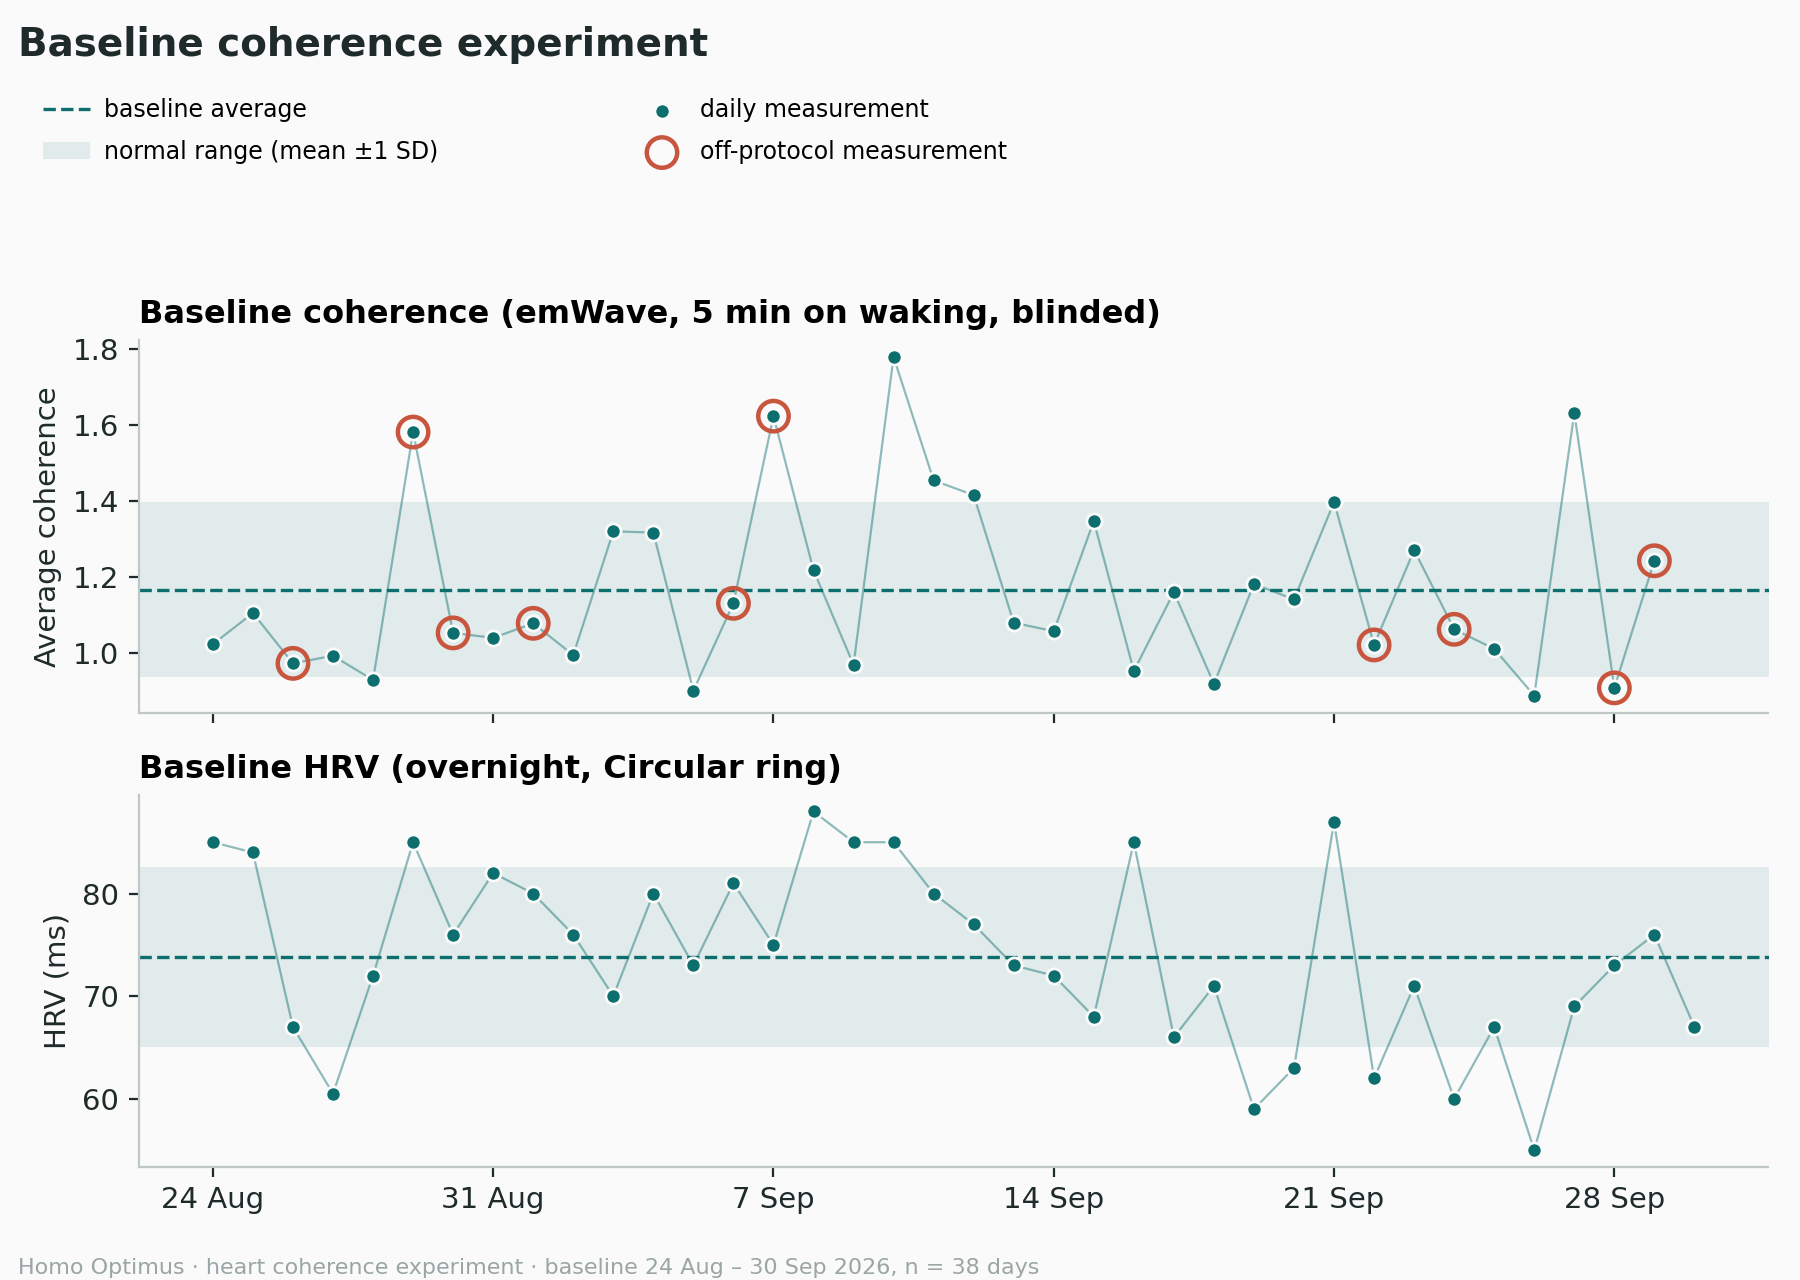
Thirty-eight days of baseline data (24th of August - 30th of September) spread over two graphs, missing only the daily coherence measurement on the 30th of September. The top one shows my average coherence during the baseline sessions, as measured with the emWave pro. The bottom one is my overnight HRV value provided by my Circular Ring.
Average coherence:
The mean average coherence is 1.17 with a standard deviation (SD) of 0.23.
Average overnight HRV:
The mean average overnight HRV is 73.8 ms with an SD of 8.8 ms.
Thresholds:
For coherence the established threshold is 1.26 and for overnight HRV it is 78.5 ms.
The numbers
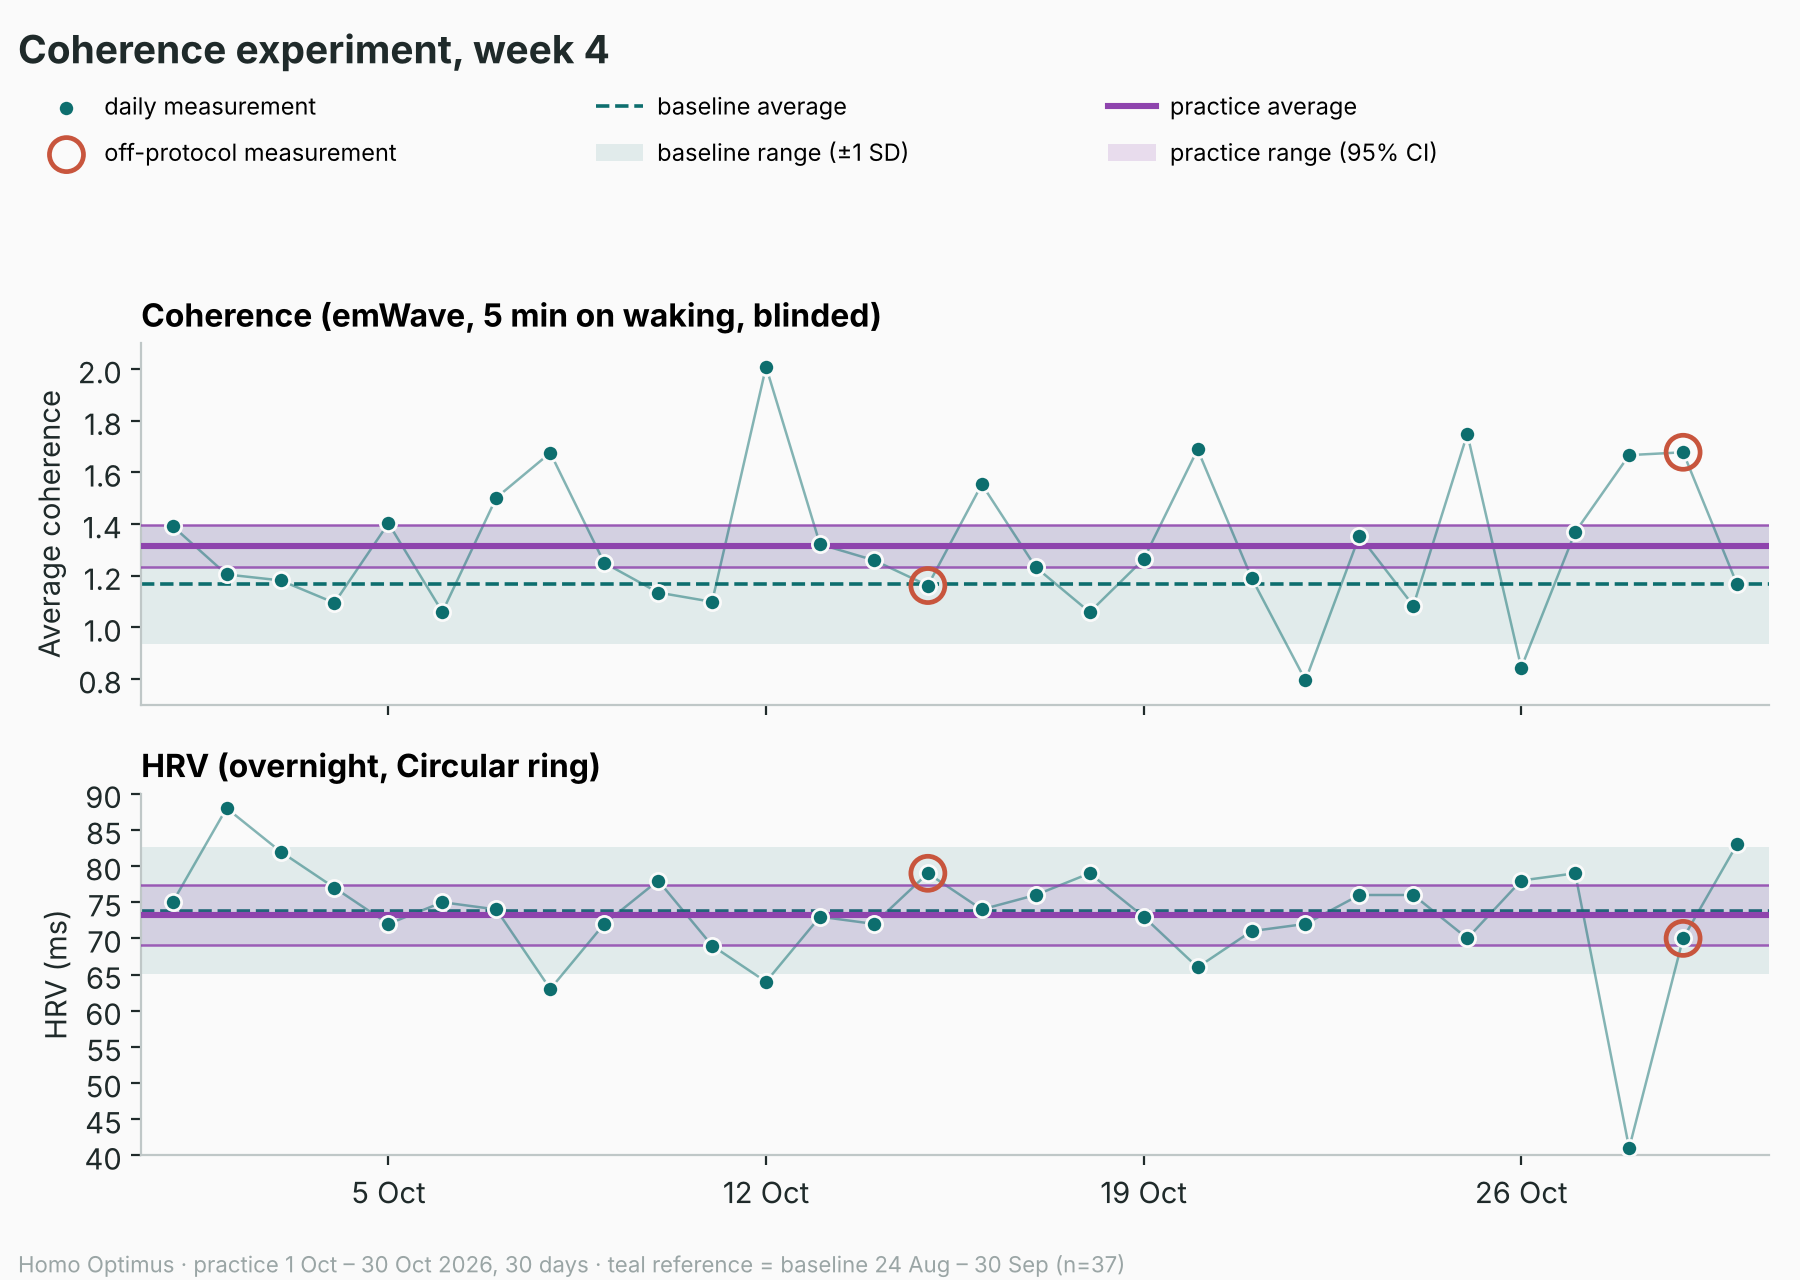
The graphs below contain the data from the experiment so far. They show the same information as the baseline ones, with two additions.
A purple line showing the practice average and a purple range band that shows the confidence interval (CI) of this average. These will change weekly when the new numbers are added to the analysis.
Average coherence:
The mean average coherence after the first month is 1.32 (up from 1.17) with an SD of 0.28.
Average overnight HRV:
The mean average overnight HRV after the first month is 73.2 ms (down from 73.8 ms) with an SD of 8.1 ms.
Confidence interval:
The CI band narrowed some more and the baseline coherence still falls outside of it. The experiment data and the baseline data are still distinguishable. Even when uncertainty in the baseline is taken into account, the practice average seems to be moving away from the baseline.1
A short explanation on the CI can be found in Heart coherence, the start.
Off-protocol measurements:
Last week there was one off-protocol measurement, but with a sidenote.
The 29th of October is the second flag due to artefacts. Only this time the artefacts were only flagged by Claude and not by the emWave pro app. Further investigation showed it was a false positive caused by a large breathing swing, not noise. The rule used by Claude to detect artefacts marks this as off-protocol.
Like I said, I will not change anything during the experiment, so measurements like these will end up flagged, but I will comment when it happens. After the experiment, the rule will be adjusted.
Interpretation:
The average coherence seems to stay above the established threshold, but with an SD of 0.28 the spread seems to be widening slightly. Week 4 on its own has the highest average coherence yet and it was during a week where my routine was slightly disrupted and not for the better.
The average baseline coherence still falls outside of the CI (1.24 - 1.40), but the CI does not yet clear the threshold.
Overnight HRV has now dipped below the baseline value. It currently sits 0.6 ms below it. The CI (69.1 - 77.4) still includes the baseline average value, but no longer the 78.5 ms threshold. The spread has widened, but mostly due to one reading. Allow me to elaborate.
This week I had my worst overnight HRV reading from the whole experiment, including the baseline period. If it weren’t for this one measurement, there would have been no remarkable changes. What is my hypothesis on how this happened? The night before the reading I had a social dinner with about three drinks at a friend’s place. Both the dinner and the drinks were a bit later than I have had them so far, so I would attribute the low HRV to this.
What does the data show so far? Mind you, I went looking for the data because of a bad reading, so this is not an independent check. I have had five “three-drink evenings” so far and they average 58.8 ms the next morning against 74.4 ms after alcohol-free ones. Evenings with only one drink, during an early dinner, showed no effect.
This is barely a discovery since it is well established that alcohol suppresses HRV. It does tell me that my readings pick up what they ought to pick up.
Halfway now. Coherence has been running above baseline, but only slightly. HRV on the other hand has given no clear signal yet.
Adherence
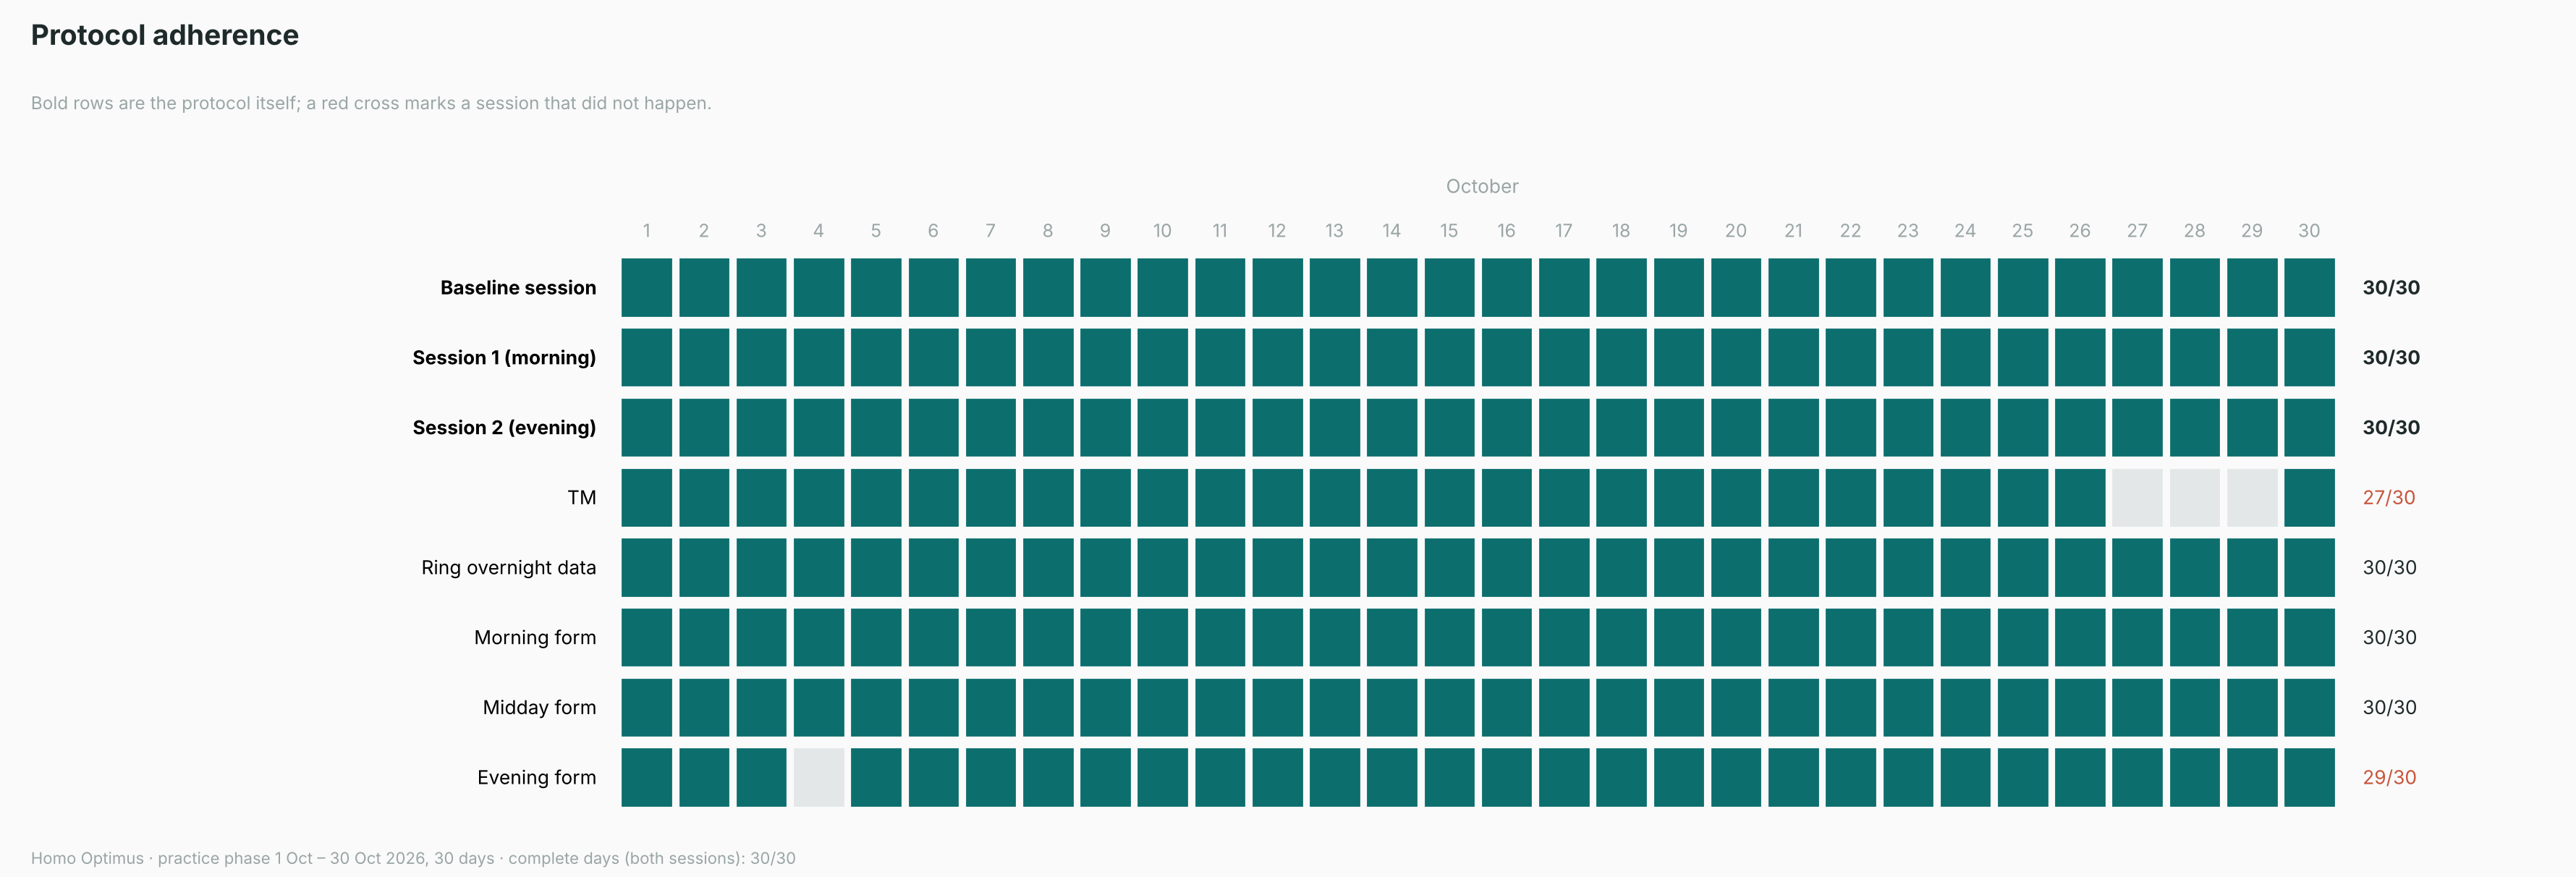
The adherence grid below shows how well I stuck to the protocol. The top three rows are the most important. They specifically concern the baseline and practice sessions. These will be marked with a red cross when they have not been executed.
The rows below show how well I logged everything else in my app. These will be blank when they are not filled in.
Protocol adherence:
Complete
Logging adherence:
Missed three TM sessions between the 27th and the 29th of October.
What was going on
Last week I assisted at a driving course. Due to the distance to home, I slept at a friend’s place. The days were filled and more exhausting than usual (I guess that’s what instructing does to a person). An unexpected dinner with some unexpected alcohol (I do not always have a lot of character) has definitely taken a toll on my readings this week.
Since the week is not over yet and I still have some renovating to do, I can again say that it was quite a busy week.
Sidebar
With regards to the sidebar of last week I can now say that the S1 sessions are no longer consistent. This week the average of the morning sessions was lower than the previous weeks and the gap with the evening session was smaller.
So far I have only been talking about my primary metrics (average coherence and average overnight HRV). Since we are now halfway, I will shed some light on the secondary metrics.
Alongside the primary metrics I am also tracking nineteen secondary ones. Only one of them really moved. I am sorry for a rather boring paragraph, but it is the honest answer. The one that moved was self-rated morning stress. But this subjective rating works more as an event detector than an intervention detector. Every one of the high-stress mornings had an identifiable cause. I guess life might sometimes be too random to notice anything.
Worth noting that out of nineteen comparisons you would expect about one to look interesting by pure chance. This is reassuring in a way, since it suggests the numbers are not throwing up false patterns.
But this is just an early look at the secondary metrics. On to the second half of the experiment!
Coherence gap: +0.148, 95% CI +0.024 to +0.272, p=0.020.