

A bit over three weeks into the experiment now. Looking at the data I am happy I decided to run the experiment for two months instead of just one. Seeing the numbers, week by week, clearly shows how volatile they can be and how wrong I would be if I were to draw conclusions after just a short period.
Reminder: these are just my weekly numbers and they should not be seen as results. We can speak of those when the experiment concludes, after two months of data. Checking the numbers weekly will be interesting, but the actual results will only be visible at the finish line.
The (double-checked) baseline
For starters a quick recap of the baseline. These graphs are the standard to which the numbers of the following weeks will be compared.
More information about these graphs can be found in the post Heart coherence, the start.
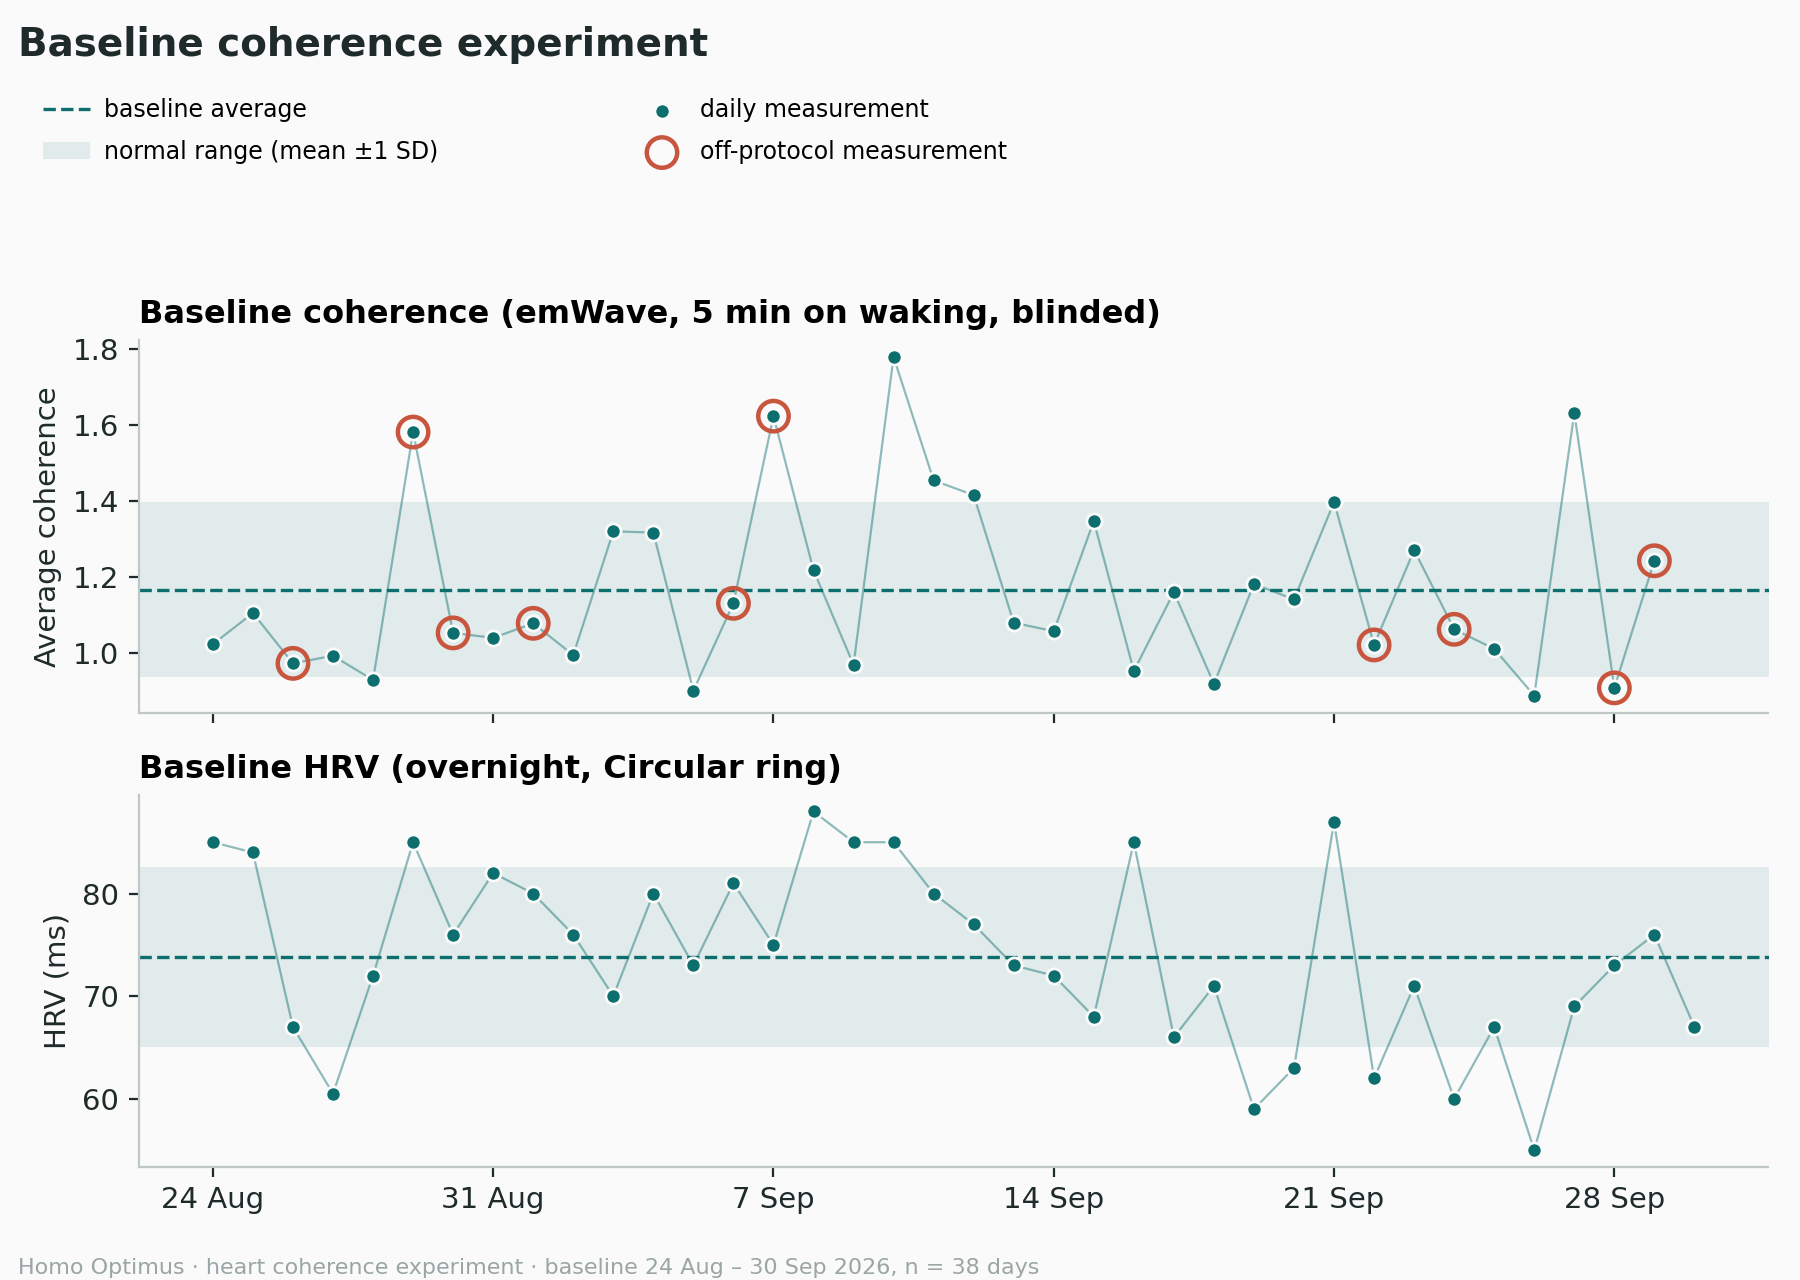
Thirty-eight days of baseline data (24th of August - 30th of September) spread over two graphs, missing only the daily coherence measurement on the 30th of September. The top one shows my average coherence during the baseline sessions, as measured with the emWave pro. The bottom one is my overnight HRV value provided by my Circular Ring.
Average coherence:
The mean average coherence is 1.17 with a standard deviation (SD) of 0.23.
Average overnight HRV:
The mean average overnight HRV is 73.8 ms with an SD of 8.8 ms.
Thresholds:
For coherence the established threshold is 1.26 and for overnight HRV it is 78.5 ms.
The numbers
The graphs below contain the data from the experiment. They show the same information as the baseline ones, with two additions.
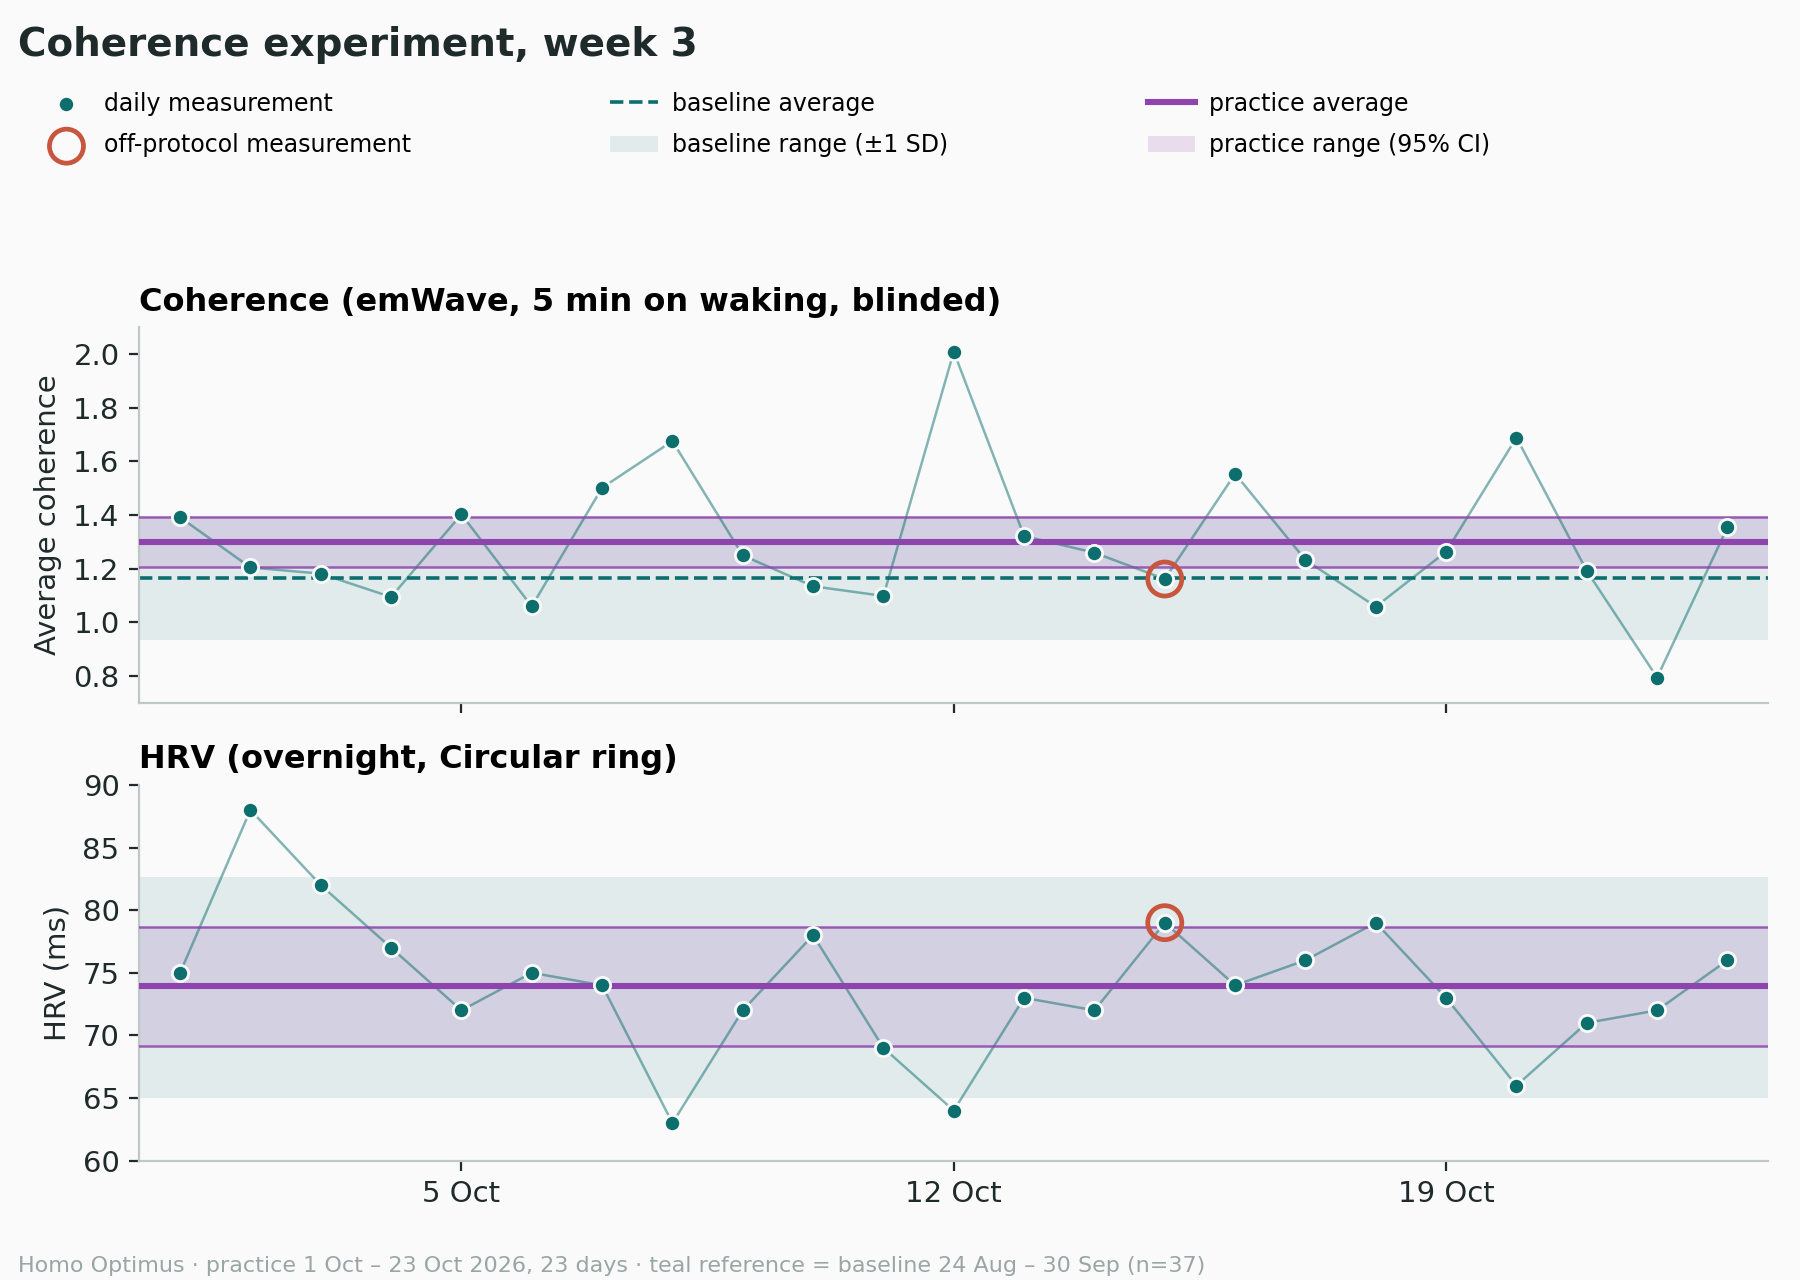
A purple line showing the practice average and a purple range band that shows the confidence interval (CI) of this average. These will change weekly when the new numbers are added to the analysis.
Average coherence:
The mean average coherence so far is 1.30 (up from 1.17) with an SD of 0.26.
Average overnight HRV:
The mean average overnight HRV so far is 73.9 ms (near identical to 73.8 ms) with an SD of 5.6 ms.
Confidence interval:
The CI band narrowed some more and the baseline coherence still falls outside of it. The experiment data and the baseline data are still distinguishable.
A short explanation on the CI can be found in Heart coherence, the start.
Off-protocol measurements:
No off-protocol measurements this week.
Interpretation:
The average coherence still sits slightly above the established threshold, but with an SD of 0.26 you can clearly see the range of measurements widening. Week 3 on its own has the lowest average coherence yet and it contains the lowest reading yet (baseline period included) on the 22nd of October. Just like the single high reading from last week there is no specific explanation for it and the measurement was solid.
The average baseline coherence still falls outside of the CI (1.21 - 1.39), but the CI does not yet clear the threshold.
Overnight HRV seems to be returning to the baseline value. It currently only sits 0.1 ms above it. The CI (69.2 - 78.7) still includes the baseline average value and the 78.5 ms threshold. The spread is tightening though.
Three weeks in, the numbers are not really showing me clear results just yet.
Adherence
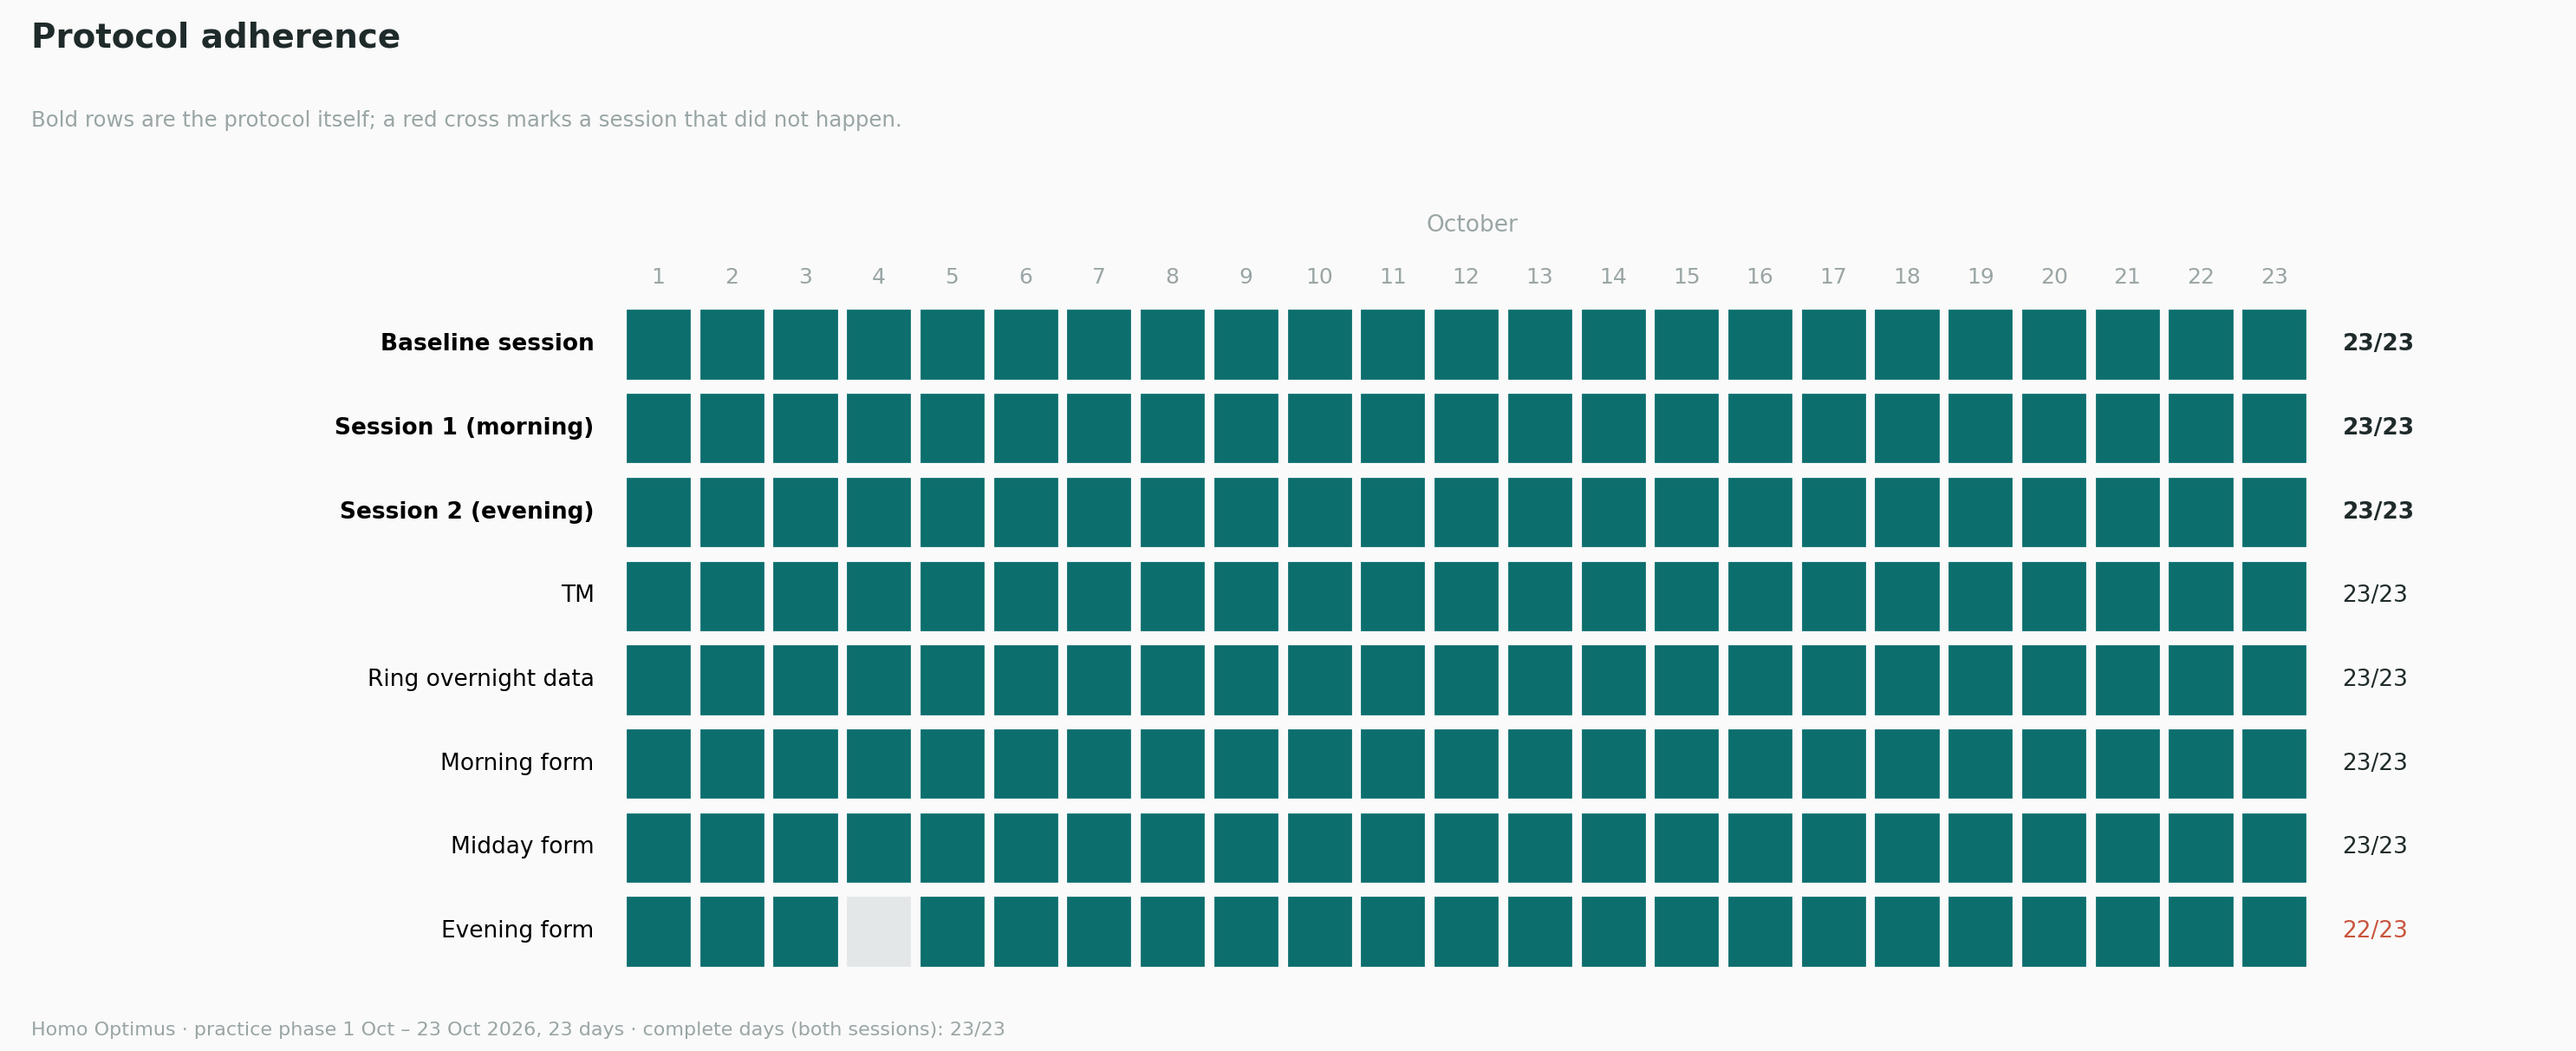
The adherence grid below shows how well I stuck to the protocol. The top three rows are the most important. They specifically concern the baseline and practice sessions. These will be marked with a red cross when they have not been executed.
The rows below show how well I logged everything else in my app. These will be blank when they are not filled in.
Protocol adherence:
Complete
Logging adherence:
Complete for this week
What was going on
Another rather busy week, but according to my log I remained calm. During the day I was mostly working on developing my coaching business (both in a practical and intellectual way) and I spent most of my nights attending webinars on different topics, from breathing to investing.
Sidebar
After three weeks there is something to be said about my practice sessions S1 (morning) and S2 (evening). This is exploratory, not a conclusion.
The morning sessions score consistently higher than the evening ones. The average for S1 is 5.10 with an SD of 0.56 and the average for S2 is 4.14 with an SD of 0.92. The gap between both averages is 0.96.
While the morning sessions were consistent throughout the first three weeks, the evening sessions improved meaningfully. They started out at 3.5 in the first week and have gone up to around 4.5 in the weeks after. This happened more as a step than a gradual climb, so I cannot say with certainty that it is because of training.
On to the last week before the halfway milestone!